Leading indicators are what the fortune tellers of the economy use to make predictions about a country’s future.
Also called cyclical indicators, they are a series of statistical data that point to the future direction of a nation’s economy and business cycle.
Specific economic variables precede changes in gross domestic product (GDP), while others appear before inflation begins to increase or the unemployment rate starts to change.
In most advanced and emerging economies, statisticians combine a number of different leading indicators into a general index of GDP growth or inflation.
Bond yields, for example, are a good leading indicator of the market, because investors can monitor their patterns and make predictions on which path the economy will most likely follow.
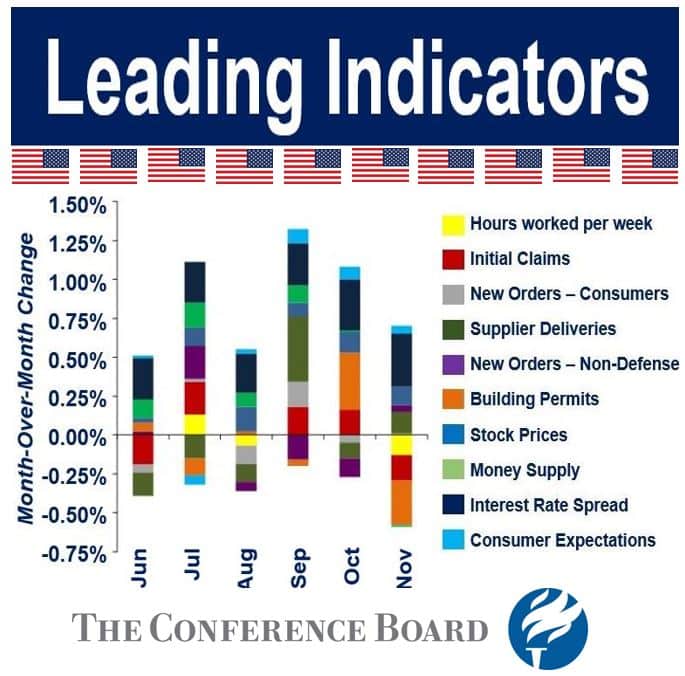 The Conference Board publishes leading indexes designed to point to peaks and troughs in the business cycles for all the world’s major economies. (Data Source: The Conference Board)
Central banks and governments gather data from the leading indicators when making decisions about monetary and fiscal policy. For example, if a recession is looming, unemployment looks likely to rise, and inflation is very low, the central bank may lower interest rates and the government might decide to spend more on large, labor-intensive projects.
Companies use their data to prepare themselves for the future economic environment. Changes in the marketplace, even small ones, can influence their revenues significantly.
Beware of leading indicators!
These leading indicators are fallible – there is not always a concrete causal relationship between their data and what they predict. Just a tiny percentage of economists across the world predicted the global financial crisis of 2007/8 and the Great Recession that followed.
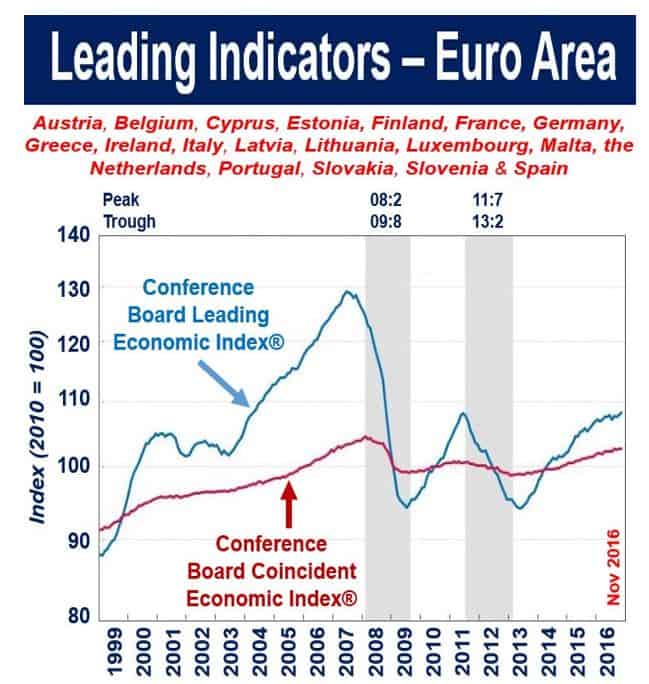 As you can see in this image, the Conference Board Leading Economic Index® for the Euro Area rose by 0.3% in November 2016 to 108.2, and the Conference Board Coincident Economic Index® remained unchanged at 102.7. (Data Source: www.conference-board.org)
Most economists had predicted an economic meltdown following the Brexit (Britain Exiting the European Union) vote in the UK’s referendum on 23rd June, 2016. They said the nosedive would start immediately.
So far (January 2016), the British economy has done well – considerably better than expected. It was the fastest growing advanced economy of 2016. The economists had used economic models with a number of inputted leading indicators to examine several different scenarios – they got most of their forecasts completely wrong!
Some leading indicators
– Stock market returns are a leading indicator. The stock market typically begins to move downward before the economy as a whole starts to weaken. When the stock market starts to move upward during a slump, an improvement in the general economy usually follows.
– Interest Rates are probably the most important indicator as far as the average individual is concerned. Rising and falling interest rates influence the liquidity status of companies and people. When interest rates rise and you have debts, your disposable income declines – when they fall, you have more spare cash.
An interest rate hike usually slows down an economy, which is a good thing if it has become overheated.
– Real GDP data is usually released by a government department every quarter, including recent revisions. Each release comes with an explanation of why gross domestic product grew, shrank or remained unchanged compared to the previous quarter.
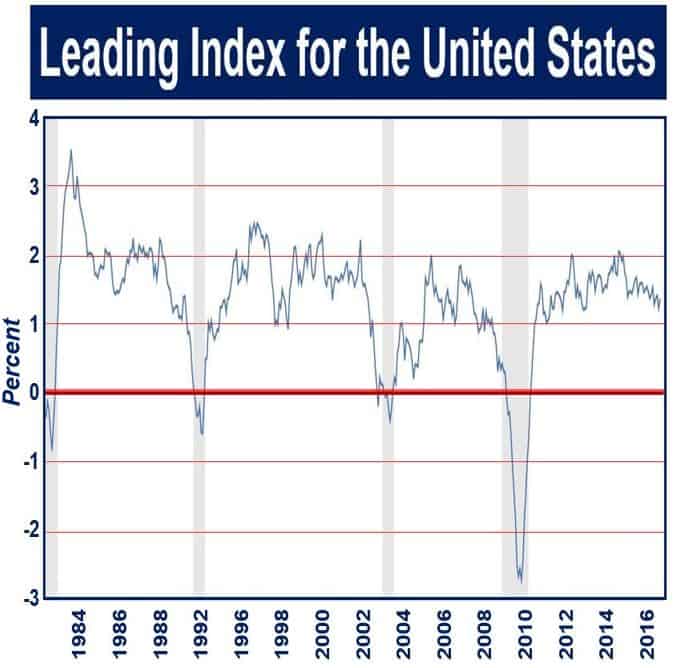 The image above shows how much US Gross Domestic Product grew-contracted by (annualized) over the past thirty-two years. On four occasions – in the shaded ‘recession’ periods – GDP shrank. (Source: Federal Reserve Bank of St. Louis)
Money Supply (M2), which does not include any special reserves that banks are legally required to maintain, large denominated time deposits, or institutional money fund assets.
Central banks use this information to assess current financial and economic conditions. This data helps them decide whether to change interest rates.
Money supply data is also used to predict cyclical recessions and recoveries, as well as changes in stock prices. Many economists say that over the past two decades, M2’s relevancy has declined.
– Building Permits tell us how active construction will be in the short-term future. In the United States, for example, the majority of cities issue permits two to three months after the property buyer signs the new home sale contract. That is usually up to nine months before construction companies finish building the new home.
When building permit numbers begin to decline, we know that demand for new housing is also lower. When this occurs, it usually means that the resale market is also weakening. When the construction sector slumps, the whole economy feels it.
– Consumer Price Index, often referred to by its initials ‘CPI’. This data includes a sample of several hundred products and services across a couple of hundred item categories. Data is gathered through face-to-face and telephone interviews across the country.
In most countries, CPI data does not include life insurance, bonds, investment in stocks, social security taxes, or income. It does include all sales taxes levied on goods and services.
– Producer Price Index, also known as ‘PPI’. This indicator tracks changes in prices in every goods-producing sector, including manufacturing, fisheries, forestry, agriculture and mining.
It also includes price changes in a growing portion of the non-products-producing sectors. In the United States, the PPI tracks the prices from 25,000 entities across the country.
– Consumer Confidence, this indicator may come under a number of names, depending on the country.
In the USA it is called the ‘Consumer Confidence Survey’. Thousands of consumers across the country – a representative sample – are asked questions regarding what they think and feel about business conditions, consumer spending, economic growth, employment prospects & the labor market generally, and their personal financial situation today and in six months’ time.
The respondents can answer in one of three ways: positive, negative and neutral.
– The Employment Rate tells us how many people are working or looking for work, and what percentage they represent of the total labor force. An unemployment rate of 3% to 5% means the economy is doing well.
When unemployment is high, consumers have less disposable income – this has a negative impact on the housing market, GDP, retail stores, stocks, and most other parts of the economy. Government debt also tends to rise when joblessness increases, due to a decline in revenue from income taxes.
– Average Weekly Hours (manufacturing) is a sensitive measure of labor demand. Adjustments to how many hours existing employees work are generally made before new workers are taken on or existing ones are laid off.
Employers tend to increase or decrease hours worked in response to manufacturers’ orders, planned production schedules, corporate profits, and other business-related activity.
Since the turn of the century, economists’ and pollsters’ predictions have become progressively less and less accurate. Hardly anybody predicted the 2007/8 global financial crisis, nearly all pollsters though Britons would vote to remain in the European Union, and that Hilary Clinton would win the US presidential elections. Most economists’ predictions regarding the British economy immediately after a Brexit vote were way off the mark.
Lagging vs leading indicators
As their names suggest, lagging indicators tell us what happened while leading indicators tell us what is going to happen – one lags while the other leads.
Lagging indicators either include data about an economy’s past, or information that has taken so long to get ready and publish that it no longer reflects what is currently occurring, but rather what has happened recently.
Quarterly GDP reports tell us what happened in the last quarter – an example of a lagging indicator. Other lagging indicators include corporate profits, interest rates, and labor cost per unit of output.
Coincident Indicators are statistics that refer to things that are happening now.
 Satya Nadella has been Chief Executive Office of Microsoft since 4th February, 2014. He used to be Executive Vice President of Microsoft’s cloud and enterprise group. He was born in 1967 in Hyderabad, Andhra Pradesh, India. (Image: twitter.com/satyanadella)
The direction of leading indicators
Indicators can move in various directions relative to the way that the general economy is going:
Procyclical Indicators move in the same direction as the economy. When everything is doing well they increase, and decline when things are going badly. GDP, for example, is a procyclical indicator.
Countercylical Indicators follow a path that is opposite to the general economy’s. For example, when the economy declines the unemployment rate usually grows, but when GDP expands the number of people out of work shrinks.
Acyclical Indicators have a mind of their own. When the general economy is growing, an acyclical indicator may rise or fall. An example is international trade (imports and/or exports).
Leading indicators in other languages: les principaux indicateurs (French), Indicadores principales (Spanish), Indicadores principais (Portuguese), indicatori anticipatori (Italian), Frühindikatoren (German), опережающие индикаторы (Russsian), 先行指標 (Japanese), 领先指标 (Chinese), المؤشرات الرائدة (Arabic), प्रमुख संकेतक (Hindi), নেতৃস্থানীয় সূচক (Bengali), indikator terkemuka (Indonesian), viashiria kuongoza (Swahili), and nangungunang mga tagapagpabatid (Filipino).
Video – What are the Leading Indicators
This video, from our YouTube partner channel – Marketing Business Network, explains what the ‘Leading Indicators’ are using simple and easy-to-understand language and examples.