The misery index is the sum of a nation’s unemployment and inflation rates over a given period. It is an unofficial measure of the state of a country’s health. The higher the index the worse off an economy is, while the lower the index the better the country’s economic situation.
It is assumed that a combination of worsening inflation and a higher unemployment creates social and economic costs for a country.
The Index was created by Arthur Melvin Okun (1928-1980), an American economist who served as chairman of the Council of Economic Advisers and was a professor at Yale University. He also promulgated Okun’s law, which states that for every one-percent increase in the unemployment rate, GDP will be about 2% lower than it could have been.
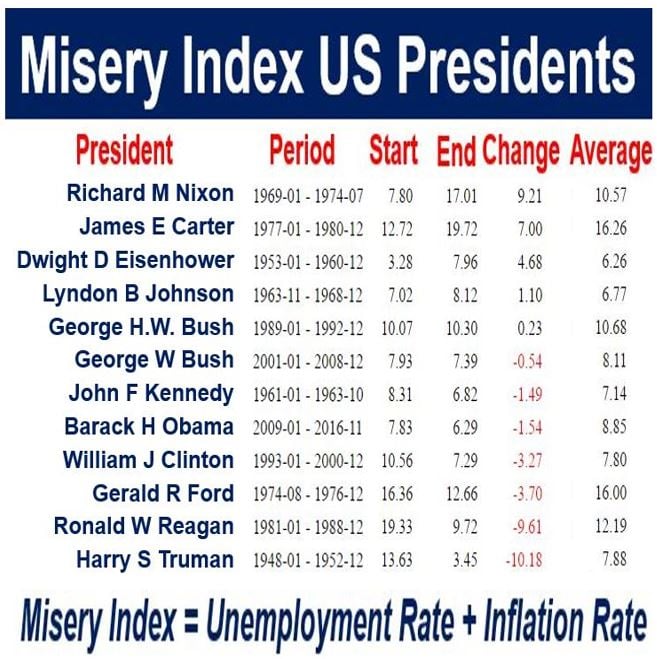
 The table above is listed according to ‘Change’, with the worst President at the top. As far as the Misery Index is concerned, Richard Nixon was the worst, while Harry Truman was the best. (Data Source: miseryindex.us)
Misery Index – variations
Since it was created, there have been a number of variations to the Index.
In 1999, the Barro Misery Index or BMI was created by Robert Joseph Barro, an American classical macroeconomist and the Paul M. Warburg Professor of Economics at Harvard University. In March 2016, he was ranked as the 5th most influential economist in the world by the Research Papers in Economics.
The BMI takes the sum of the unemployment and inflation rates over a specific period, and adds to that total the interest rate, plus/minus the surplus/shortfall between the actual and trend rate of GDP growth.
Steve H. Hanke, an American applied economist at the Johns Hopkins University in Baltimore, Maryland, built upon the BMI and started applying it to countries across the world.
Prof. Hanke’s index is the sum of the interest, unemployment and inflation rates, minus the year-to-year percentage change in GDP growth per capita.
Prof. Hanke recently created a World Table of Misery Index Score using data reported by the Economist Intelligence Unit for December 2013. The table ranks eighty-nine countries.
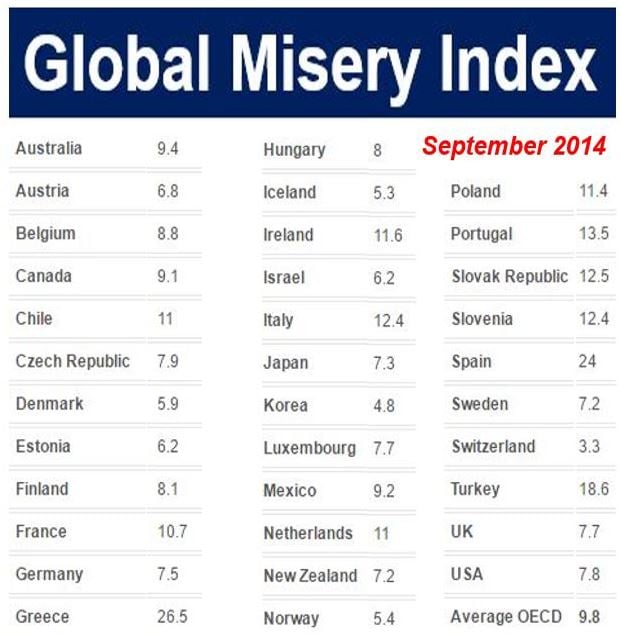
 In September 2014, Greece had the worst Misery Index figure while Switzerland had the worst. (Data Source: Magna Carta 2015)
According to the Cambridge Dictionary, to define the misery index is:
“A measure of how the economy of a country is doing that combines the rate of inflation and the unemployment rate.”
Criticism of the misery index
The Index has been criticized by many economists and sociologists since it was first created.
An article – ‘Preferences over Inflation and Unemployment: Evidence from Surveys of Happiness’ – written by Rafael Di Tella, Robert J. MacCulloch and Andrew J. Oswald, published in the The American Economic Review in 2001, concluded that unemployment contributes much more to unhappiness than inflation does.
The authors concluded that the index underweights the unhappiness that is attributable to the unemployment rate.
Correlation with crime rate
Some studies have found a degree of correlation between the misery index and the crime rate. A study published in Economic Letters – ‘New evidence from the misery index in the crime function’ – written by Chor Foon Tanga and Hooi Hooi Lean, published in 2009, found a strong correlation between the misery index and the crime rate.
After gathering and analyzing data from 1960 to 2005, the authors found that the correlation was so strong that the two could be said to be cointegrated. The crime rate and the index were found to be more strongly correlated than the unemployment rate was to the inflation rate.
In virtually every case from 1960 to 2005, the Index appeared to lead the crime rate by about one year.
Video – Reagan on the Misery Index
In this video, you can hear Ronald Reagan criticizing President Jimmy Carter, who he blamed for pushing up the Misery Index.
