
An optimal price is the price that best meets a defined pricing objective under the relevant conditions. When the objective is profit, it means the price expected to produce the highest total profit over a specified period.
That price depends on how many units customers are expected to buy, the costs of serving them, capacity and competition. It is not necessarily the highest price, the lowest price or the price generating the most revenue.
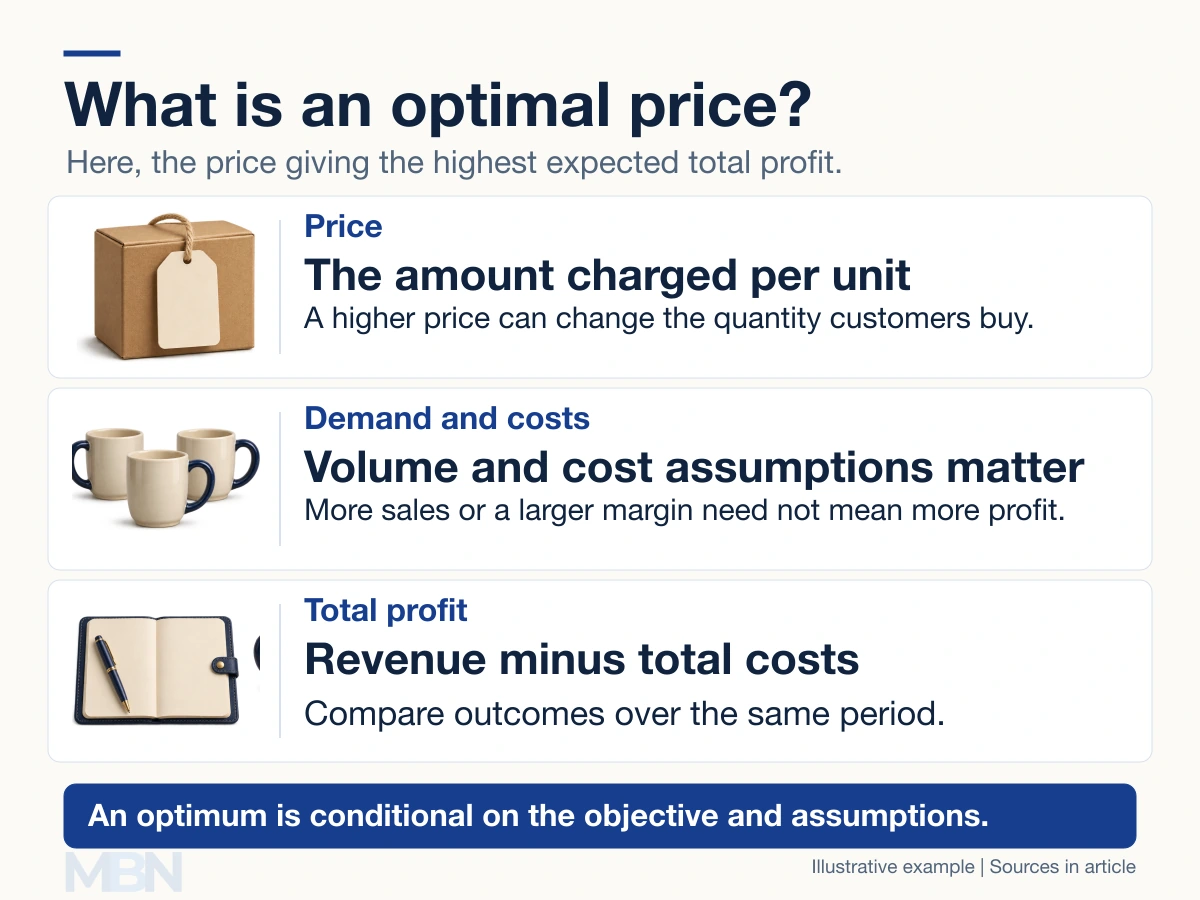
What makes a price optimal?
Profit is revenue minus total costs. Revenue is price multiplied by quantity sold. A higher price may increase the amount earned per unit while reducing sales, so both effects matter.
The Australian Government’s pricing guidance distinguishes profit from other possible goals, such as market share. A price chosen to build a customer base may therefore differ from one chosen to maximize this period’s profit.
A worked mug-pricing example
Suppose a fictional business compares three prices for the same mug over one period. Variable cost is $6 per unit and fixed costs are $100. Expected sales are 100 units at $10, 80 at $12 and 50 at $14. These demand figures are invented, not observed market results.
At $10, revenue is $1,000 and total costs are $700, leaving $300 profit. At $12, revenue is $960 and costs are $580, leaving $380. At $14, revenue is $700 and costs are $400, leaving $300.
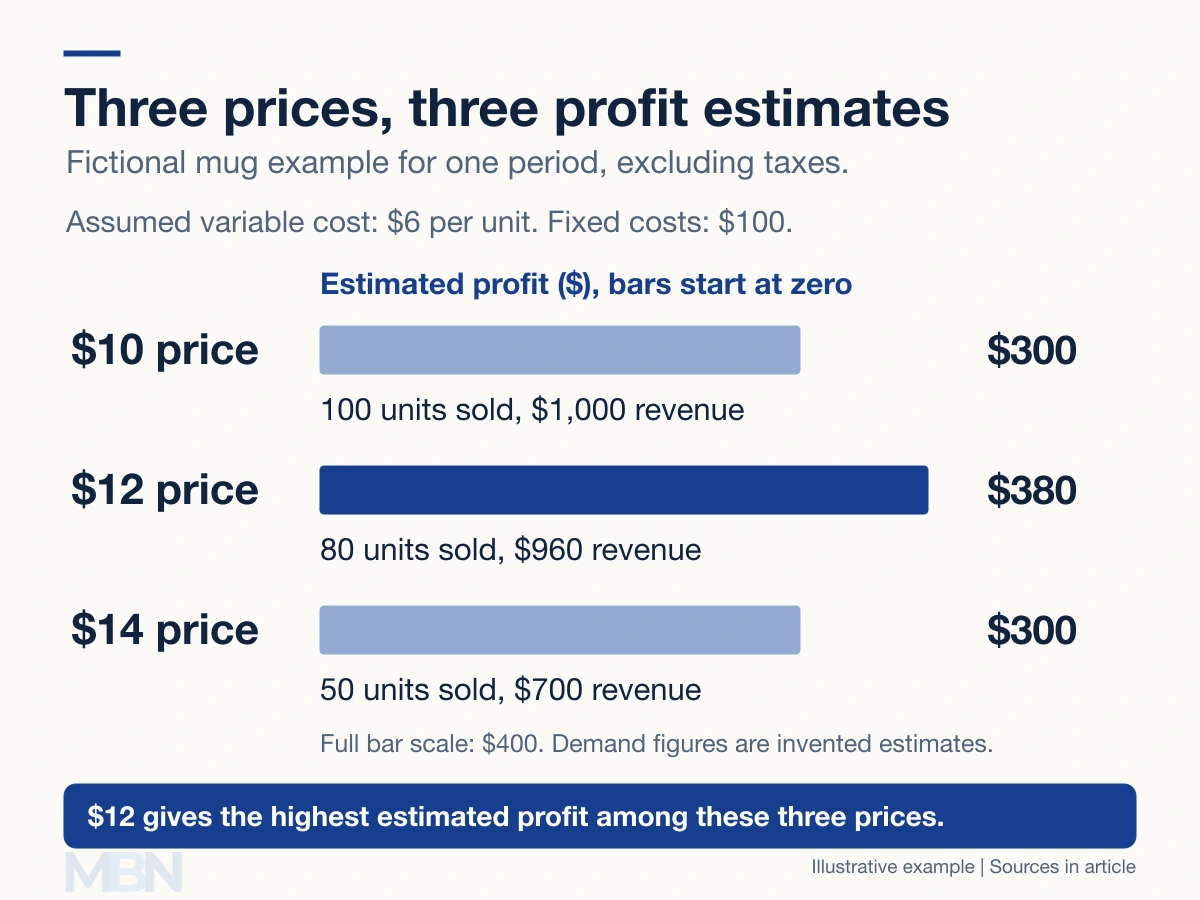
The $12 price gives the highest estimated profit among these three choices. It does not prove that $12 is best among every possible price or under different demand conditions.
Contribution and break-even volume
Variable costs change with production or sales volume. Fixed costs remain unchanged over a specified period and range of activity. Labour can contain fixed and variable elements; it is not always entirely variable.
Contribution per unit equals selling price minus variable cost per unit. In the example, a $12 price gives a $6 contribution. This contribution must cover fixed costs before there is a profit.
For a single product with positive contribution, break-even volume equals fixed costs divided by contribution per unit. The US Small Business Administration’s calculator uses this relationship. Here, $100 ÷ $6 is about 16.67, so 17 whole units are needed to avoid a loss under the assumptions.
Adding a target profit to fixed costs gives the contribution needed for that target. This calculation still does not establish that customers will buy the required quantity.
Why the estimate can change
If expected sales fall below break-even, raising the price is not automatically the answer. A higher price may reduce sales further. The UK Government’s guidance on existing-customer sales explains the need to assess how price changes affect sales and profitability.
Customer research and pricing tests can improve estimates, but results depend on the customers, competitors and period examined. Changes in costs, capacity or demand can change the preferred price.
Last checked and updated on November 2, 2026 by the MBN editorial team.