The Phillips curve, sometimes referred to as the trade-off curve, a single-equation empirical model, shows the relationship between an economy’s unemployment and inflation rates – the lower unemployment goes, the faster prices start rise. The Phillips curve was devised by A.W.H. Phillips (1914-1975), an influential New Zealand-born economist who spent large part of his career as a professor at the London School of Economics. As well as the Phillips curve, Prof. Phillips is remembered for designing and building the MONIAC hydraulic economics computer in 1949.
In 1958, Prof. Phillips, in a paper – The Relationship between Unemployment and the Rate of Change in Money Wages in the United Kingdom – published by Economica, proposed that there was a trade-off between the unemployment and inflation rates.
In Prof. Phillip’s opinion, governments and their policymakers simply had to select the right balance between the two necessary evils.
Put simply, the Phillips Curve is a graph that shows a trade-off between wages and unemployment. Basically, when unemployment is low, wages tend to go up, and when unemployment is high, wages usually grow more slowly or even stay flat.
This idea suggests that governments often have to find a balance—they can’t always have both super low unemployment and slow wage growth at the same time. But in reality, the relationship isn’t always perfect or predictable, so it’s not a guaranteed rule—just a helpful way to think about how jobs and wages might interact.
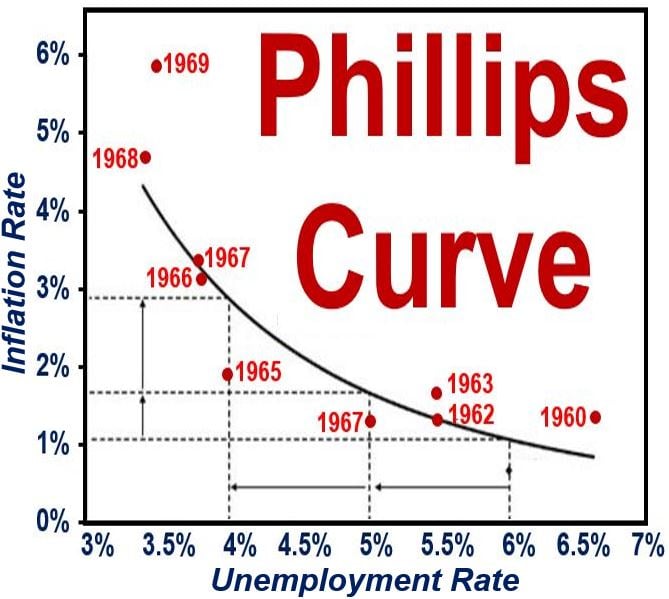
As you can see in this Phillips curve that spanned the 1960s, when unemployment was high inflation was low, but when inflation was high unemployment was low. (Data Source: US Bureau of Labor Statistics)
He found similar patterns in other countries. In 1960, Paul Samuelson (1915-2009), an American economist who was the first American to be awarded the Nobel Prize, and Robert Solow (born: 1924), an American economist who was awarded the John Bates Clark Medal in 1961, took Phillips’ work and made the link between inflation and unemployment explicit – when inflation was low, unemployment was high, and vice-versa.
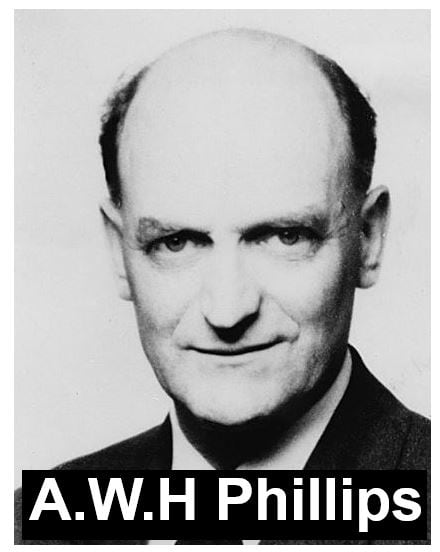
Alban William Housego Phillips, MBE (1914-1975), was born at Te Rehunga near Dannevirke, New Zeealand. His first jobs were in Australia, where he worked as a cinema manager and crocodile hunter. In 1937, while in China, he had to escape to Russia when Japan invaded the country. He arrived in Great Britain in 1938, after travelling across Russia on the Trans-Siberian Railway. He studied electrical engineering. In WWII he served as a Royal Air Force Pilot, and after being captured by the Japanese spent three years as a prisoner of war. When back in the UK, he studied at the London School of Economics, and within 11 years was a professor of economics there. (Image: Wikipedia)
Phillips curve held true till 1970s
Prof. Phillips had studied Britain’s nominal wage and jobless rates between 1861 and 1957, which showed the relationship between inflation and unemployment as a smooth curve.
The Phillips curve shows that inflation and unemployment have a stable inverse relationship – when one goes up the other declines, and vice-versa.
According to the theory, economic growth brings with it inflation, which in turn should generate more jobs and push down unemployment.
However, the original economic concept has been disproven to some extent by the emergence of stagflation in the 1970s – where high levels of inflation were accompanied by high jobless rates.
Phillips curve only true over short term
According to Milton Friedman (1912-2006), an American monetarist economist who was awarded the 1976 Nobel Prize for Economics and was US President Ronald Reagan’s and British Prime Minister Margaret Thatcher’s economic adviser in the 1980s, the Phillips curve was only applicable over the short-term but not the long-term – in the long-run, inflationary policies will not push down unemployment.
Prof. Friedman then accurately predicted that in the 1973-1975 recession, there would be an increase in both inflation and unemployment.
The Phillips curve is seen by economists today as too simplistic, with the unemployment rate replaced by more accurate inflation predictors based on velocity of money supply measures such as Money Zero Maturity (MSM) velocity, which is affected by unemployment over the short-term but not the long-term.
Since 1974, seven Nobel Prizes for Economics have been awarded to academics for, among other things, works that criticized some variations of the Phillips curve. Much of this criticism was based on the American experience in the 1970s, when both unemployment and inflation rates were simultaneously high. The Nobel laureates who criticized the curve included: Milton Friedman, Thomas Sargent, Christopher Sims, Robert E. Lucas, Edmund Phelps, Robert A. Mundell, Edward Prescott, and F.A. Hayek.
Did stagflation kill the Phillips curve?
Stagflation refers to persistent high inflation, high unemployment, and stagnant demand in a nation’s economy. Virtually all the advanced economies experienced stagflation in the 1970s.
According to theories based on the Phillips curve, this was impossible. In the 1970s, the curve came under a concerted attack by Prof. Friedman and other mainly monetarist economists, who argued that the curve was only relevant over the short-term, but not the long-term.
The new generation of economists in the 1970s, led by Prof. Friedman, said that over the long-term, workers and employers would take inflation into account, resulting in employment contracts that awarded pay increases pegged to the anticipated inflation rate. This would push up unemployment back to its previous level, but inflation rates would remain high.
This result implies, Prof. Friedman argued, that over the longer-term there was no trade-off between inflation and unemployment. Central banks should never set employment targets above the natural rate, the monetarists insisted.
Today, our current economists say reality is somewhere in between what the Phillips curve suggested and what Prof. Friedman argued – there is a moderate trade-off between low inflation rates and unemployment.
According to studies carried out by William Dickens, George Perry and George Akerlof, if inflation drops from 2% to 0%, unemployment will be permanently 1.5% higher.
This is because employees usually have a greater tolerance for real wage cuts than nominal ones. For example, if you offer a worker a 2% wage rise when inflation is at 3% or a wage cut of 1% when inflation is at zero – he or she will nearly always prefer the first option, even though real wages (purchasing power) decline by the same amount (-1%) in both cases.
From Phillips curve to NAIRU
Today, economists prefer to talk about NAIRU (Non-Accelerating Inflation Rate of Unemployment) – the level of unemployment below which inflation rises.
Conducting monetary policy under the assumption of NAIRU means allowing just enough unemployment in a country’s economy to prevent inflation rising above a specific target figure. Prices may increases gradually, that is tolerated, and so is some unemployment.
Video – Phillips Curve
This Khan Academy video explains what the Phillips curve is, how it came about, and how economists have responded to it over the decades.