
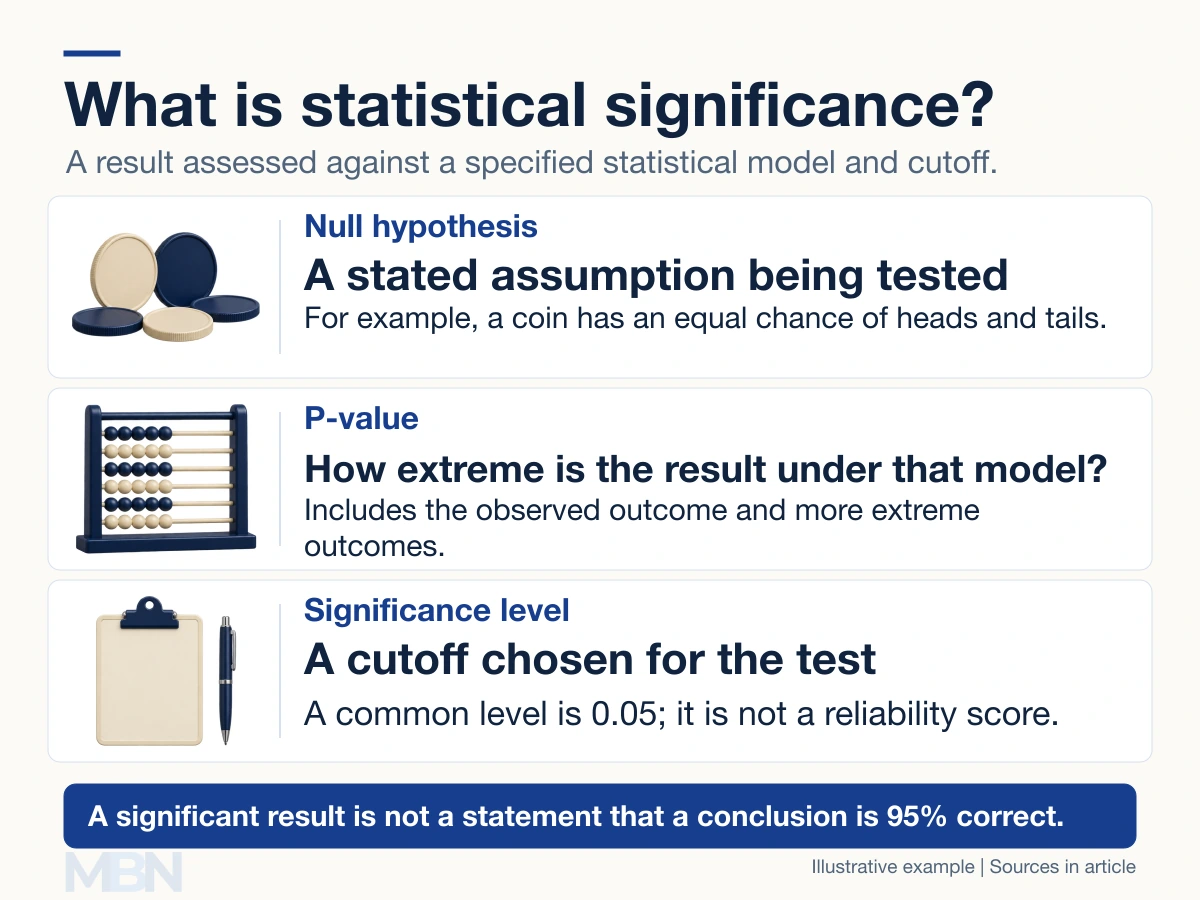
Statistical significance describes a test result that meets a chosen cutoff for incompatibility with a specified null hypothesis. It does not mean that the finding is 95% reliable or that a conclusion has a 95% chance of being correct.
A null hypothesis is an assumption being tested, such as no average difference between two groups or an equal chance of heads and tails for a coin.
What does a p-value measure?
A p-value describes the probability, under the null hypothesis and the other test assumptions, of a result at least as extreme as the one observed. The meaning of extreme depends on the test.
NIST’s statistical handbook explains how p-values relate to a significance level chosen in advance. A result below a preselected 0.05 threshold is conventionally called statistically significant at the 5% level.
A coin-toss example
Suppose a fictional experiment uses 20 independent tosses and tests whether the coin is fair, with unequal probabilities in either direction as the alternative. The observed result is 15 heads and five tails.
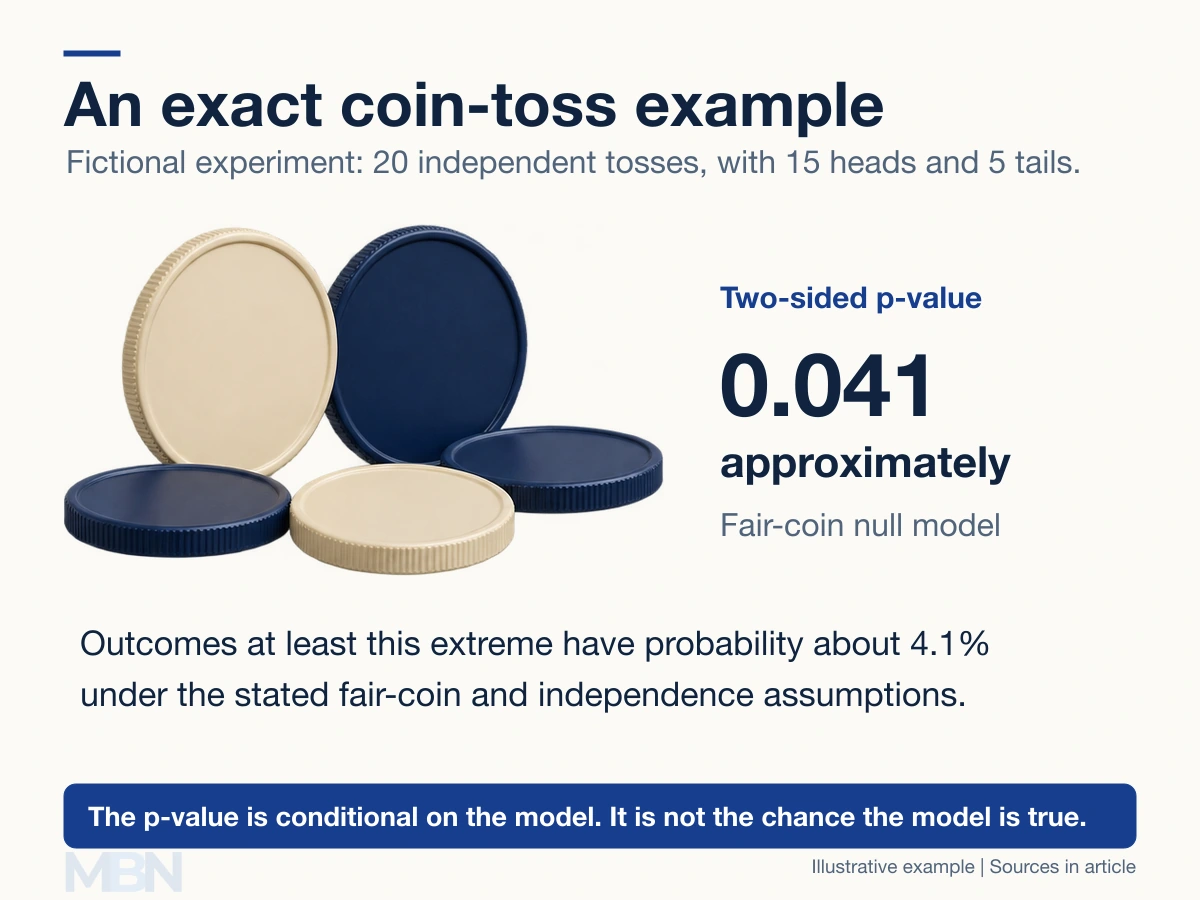
For this exact two-sided binomial test, equally or more extreme outcomes are 15 or more heads, or five or fewer heads. Adding their probabilities under a fair-coin model gives about 0.0414.
The result crosses a preselected 0.05 cutoff. It does not establish a 95.86% probability that the coin is biased, and it does not identify a reason for the observed imbalance.
What significance cannot establish
The American Statistical Association’s statement explains that a p-value is not the probability that a hypothesis is true. Nor is it the probability that chance alone produced the data.
A small p-value does not measure an effect’s size, business value or clinical importance. A tiny difference can be statistically significant in a large, precise study. A larger difference can remain uncertain in a small or noisy one.
There is no universal sample size that makes a result significant or trustworthy. Study design, measurements, variability and the analysis all affect interpretation. Statistical significance also does not by itself establish causation.
Why the wider evidence matters
The ASA president’s 2021 task force statement places p-values alongside study design, uncertainty, multiple testing and replication. Selecting only favorable results can distort the evidence, especially when many analyses have been tried.
Effect estimates and suitable uncertainty intervals add information that a significance label lacks. A result above 0.05 does not prove that an effect is absent, just as a result below it does not prove that the study’s explanation is correct.
Last checked and updated on November 3, 2026 by the MBN editorial team.