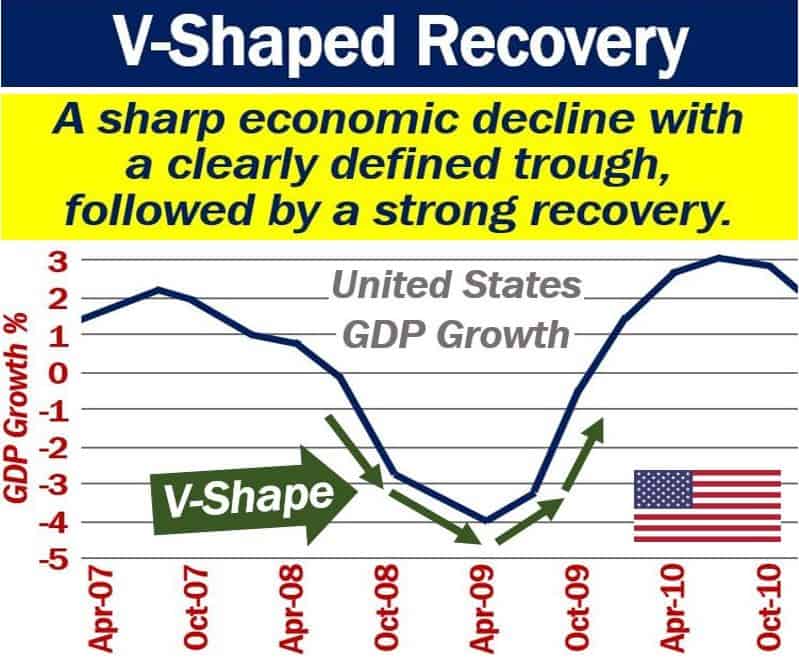
A V-shaped recovery is a period of economic decline, then a short trough, and finally a rapid recovery. We also call it a V-shaped recession. The majority of periods of ‘recession and then recovery’ come in the form of a V-shaped recovery. The economy follows a path on a chart that looks like a capital ‘V,’ hence the name.
In a typical V-shaped recovery, there is a huge shift in economic activity after the downturn and the trough. Growing consumer demand and spending drive the massive shift in economic activity.
Typically, we see a V-shaped recovery in specific economic measures, such as industrial output and unemployment. We also see it on GDP growth performance charts.
GDP stands for Gross Domestic Product. How much a country produces over a given period, i.e., all its goods and services is its GDP.

V-shaped recovery and other shapes
Economists use different shapes when describing economic patterns. Even though no specific academic classification exists for recession and recovery shapes, we use informal terminologies. These recovery patterns can apply to broader markets as well as individual stock picks.
Economists and journalists use the shapes of certain letters in the alphabet, i.e., L, U, V, and W. They use them to describe different periods of recessions followed by recoveries.
U-shaped recovery
A U-shaped recovery or U-shaped recession covers a longer period than a V-shaped recovery. It also has a less-clearly defined trough.
The U-shaped recovery has a rounded and smoother trough than the V-shaped recovery. This is because the trough period is longer in a U-shaped recovery.
During the 1970s, the United States experienced a U-shaped recovery. Unemployment, as well as inflation, were high for several years.
Simon Johnson, the former Chief Economist at the IMF, once said that a U-shaped recovery was similar to a bathtub. Johnson explained:
“You go in and stay in. The sides are slippery. You know, maybe there’s some bumpy stuff in the bottom, but you don’t come out of the bathtub for a long time.”
IMF stands for the International Monetary Fund.
W-shaped recovery
We also call it a W-shaped recession, double-dip recovery, or double-dip recession.
The economy slides into a recession and then picks up again. However, the recovery does not last long. Soon, the economy shrinks again. Finally, there is another recovery.
These yo-yo movements, i.e., down-up-down-up, give the chart a ‘W’shape, hence the name.
The United States experienced a W-shaped recovery in the early 1980s.
V-shaped recovery
Economic activity slows down sharply, i.e., the economy slides into recession. However, it does not last long.
There is a clear trough, but it does not last long either. Then, there is a rapid recovery.
The United States followed a V-shaped ‘recession and then recovery’ in the early-to-mid 1950s.
L-shaped recovery
An L-shaped recovery refers to an economy that slows down and then flatlines. In other words, it slips into a recession, hits a trough, and stays there.
Economists say that an L-shaped recovery is the government’s ultimate nightmare. There is no recovery in sight.
Obviously, the economy does eventually recover. However, it takes a very long time. On the performance chart, the base of the capital ‘L’ shape is long. Therefore, the economy stays in the doldrums for a very long time.
In 1990, there was an asset price bubble in Japan. The country experienced deflation and more than a decade of zero GDP growth. In fact, during some of those years, the economy contracted.
Japan has never returned to its post-war GDP growth rate.
