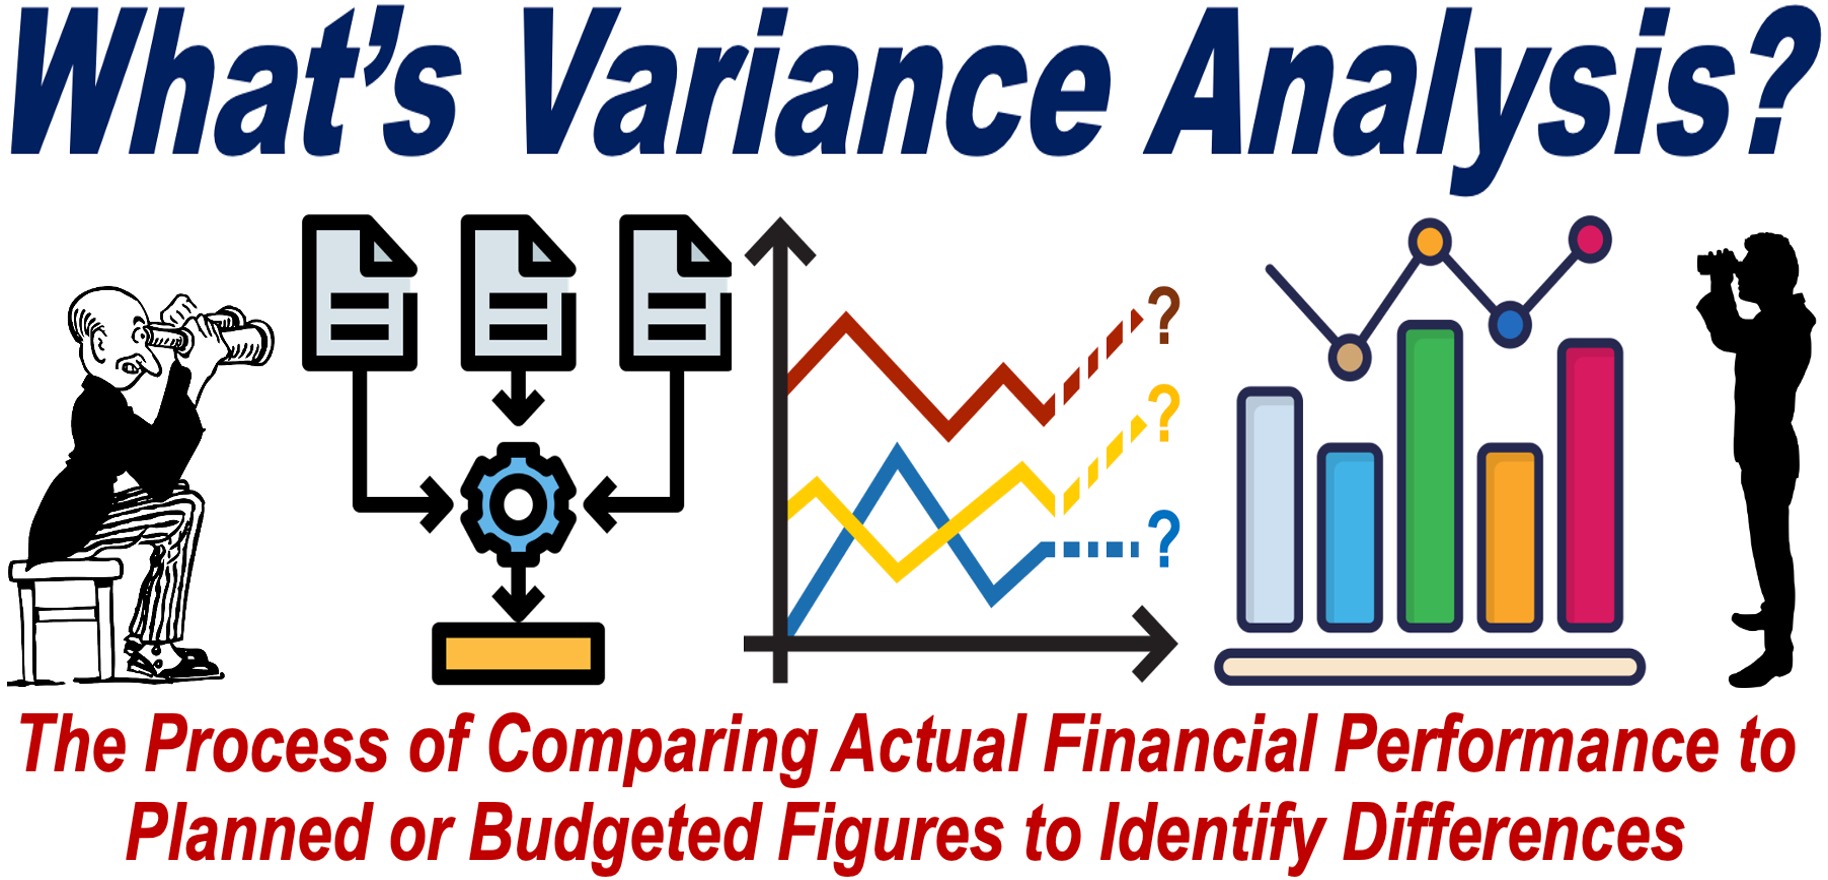
Have you ever calculated the difference between the estimated financial outcome of a project, initiative, business endeavor, or venture and the actual results? If so, you have been involved in Variance Analysis.
Variance analysis is a crucial financial tool that can help you identify areas where your financial performance may be off target, enabling you to make informed decisions to improve your business operations.
The Association for Financial Professionals has the following definition of variance analysis:
“Variance analysis is a quantitative method used to assess the difference between planned and actual financial outcomes. It is commonly used in accounting and finance to understand ‘what’ the actual deviations from the budget or forecast are, with the goal of determining ‘why.’ The deviation can be favorable (better than expected) or unfavorable (worse than expected).”
Definitions of ‘Variance’ and ‘Analysis’
-
Variance
Variance means the amount by which two or more things are different. For example, “there was some unusual variance in temperature last month.” This means that the temperatures recorded varied significantly from what was expected or typical for that time of year.
-
Analysis
Analysis refers to the detailed examination or study of something to understand its components or to uncover essential features and relationships. For example, “the scientist conducted an analysis of the data to determine the cause of the unusual results.” This means that the data was carefully examined to identify underlying patterns or explanations.

Comparing Forecasts with Actual Figures
Variance analysis is all about comparing the budgeted or forecast financial figures with the actual figures. In other words, it involves comparing what you thought the results were going to be with what they actually turned out to be.
The difference between these two sets of numbers is called a “variance.”
-
Favorable and Unfavorable Variances
These variances can be either favorable or unfavorable, depending on whether the actual figures are better or worse than what was planned.
For example, if your actual revenue exceeds the budgeted revenue, this would be considered a favorable variance. On the other hand, if your actual expenses are higher than anticipated, you’re dealing with an unfavorable variance.
Types of Variance Analyses
There are several types of variances that you might analyze, depending on your business’s focus. The most common types include revenue variance, cost variance, and profit variance:
-
Revenue Variance
Revenue variance shows how your actual revenue compares to what was expected.
-
Cost Variance
Cost variance, on the other hand, compares your actual costs to your budgeted costs.
-
Profit Variance
Profit variance looks at the difference between your actual profit and what was projected.
In the world of business and finance, there are many more variances that can be analyzed. Here are some more:
- Sales Volume Variance
- Price Variance
- Labor Variance
- Material Variance
- Overhead Variance
- Production Variance
- Efficiency Variance
- Sales Price Variance
- Sales Mix Variance
- Sales Quantity Variance
- Labor Rate Variance
- Labor Efficiency Variance
- Material Price Variance
- Material Usage Variance
- Budget Variance
Purpose of Variance Analysis
The purpose of variance analysis is not just to highlight discrepancies but to understand why they occurred. By doing so, you can pinpoint specific areas that need attention.
For instance, an unfavorable cost variance might be due to rising material costs, inefficient use of resources, or unexpected expenses.
Understanding the root cause allows you to take corrective action, whether that means negotiating better terms with suppliers, improving efficiency, or adjusting your budget.
Regular variance analysis is essential for keeping your business on track. By reviewing variances on a regular basis, you can quickly identify trends or issues before they become significant problems.
This proactive approach helps you maintain control over your business’s financial health and ensures that your strategic objectives are met.
Understanding the Past to Plan for the Future
Variance analysis is not just a backward-looking tool. It also has predictive value. By understanding past variances, you can make better forecasts and improve your future planning.
For example, if you consistently see a particular cost exceeding your budget, you might decide to adjust your budget for that item in the future.
Variance Analysis – Brief Background
The concept of variance analysis dates back to the early 20th century. In the 1920s-1930s, it emerged from the scientific management movement as businesses formalized budgeting and needed to compare actual results against plans.
The term “variance analysis” started appearing in the 1940s. By the 1950s-1960s, variance analysis gained popularity as management accounting matured, becoming essential for financial management in growing corporations.
The 1970s saw further popularization with the advent of computerized accounting systems, making the process more accessible.
Today, variance analysis is a standard tool in financial management, reflecting its century-long evolution alongside business practices.
Final Thoughts
Let’s recap. Variance analysis is a crucial financial tool that involves comparing budgeted or forecast figures with actual results.
It helps you identify discrepancies, whether they are favorable or unfavorable, and understand why they occurred.
By regularly conducting this analysis, you can make better-informed decisions, adjust your strategies as needed, and improve your financial performance. This ongoing process ensures that your business stays on course and meets its financial objectives.
