
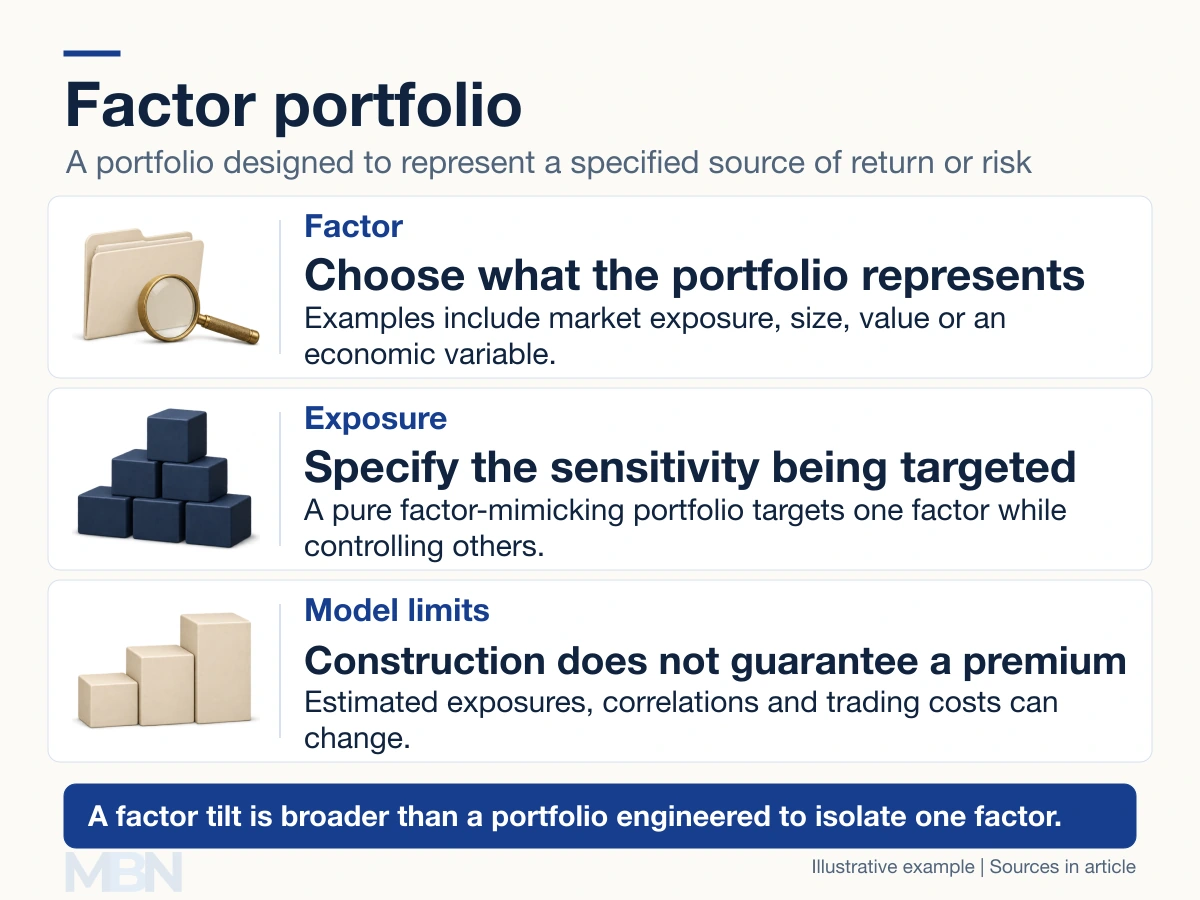
A factor portfolio is constructed to represent a specified source of investment return or risk. In the strict factor-mimicking sense, it aims for a sensitivity of one to a chosen factor and zero to the other factors in a stated model. Broader factor-investing portfolios may simply tilt toward characteristics such as value or size.
A portfolio is a collection of investments. A factor is a variable used to explain how their returns behave. Nasdaq’s glossary gives the strict model-based definition; it should not be read as a guarantee that the portfolio will outperform a market index.
What does factor exposure mean?
A factor loading, often called a beta, measures a return’s sensitivity to a specified factor. William Sharpe’s explanation of linear factor models separates these modeled contributions from a residual, the part of return not explained by the factors.
If a return-based factor rises by one percentage point and a portfolio has a loading of one to it, the model assigns a one-percentage-point contribution from that factor, holding the other inputs fixed. Actual portfolio return can still differ because of other components and estimation error.
Market beta is one particular exposure. A beta of one to an inflation factor does not mean the portfolio moves one-for-one with the stock market. The factor’s definition and units must be specified before interpreting the loading.
Exposures also need not be zero or one. Those values can encode membership in a country or industry category, but continuous variables and estimated sensitivities can take other values.
How factor portfolios are constructed
One approach sorts securities by a characteristic and compares baskets. Another uses a statistical model and portfolio weights to target one exposure while controlling other included factors. Looking at a factor alone can confound it with correlated influences; controlling several factors together addresses a different question.
The Fama-French research factors provide familiar return-spread examples. SMB, small minus big, compares average returns of small-company portfolios with large-company portfolios. HML, high minus low, compares high book-to-market portfolios with low book-to-market portfolios. Book-to-market compares accounting equity with market equity value.
A long-short example
Suppose a simplified size construction has $100 of long exposure to a small-stock basket and $100 of short exposure to a large-stock basket. A long position benefits when its asset rises; a short position generally benefits when its asset falls.
If the small-stock basket rises 8% and the large-stock basket rises 5%, the long side gains $8 and the short side loses $5. The gross gain is $3, corresponding to an 8% minus 5% return spread of three percentage points.
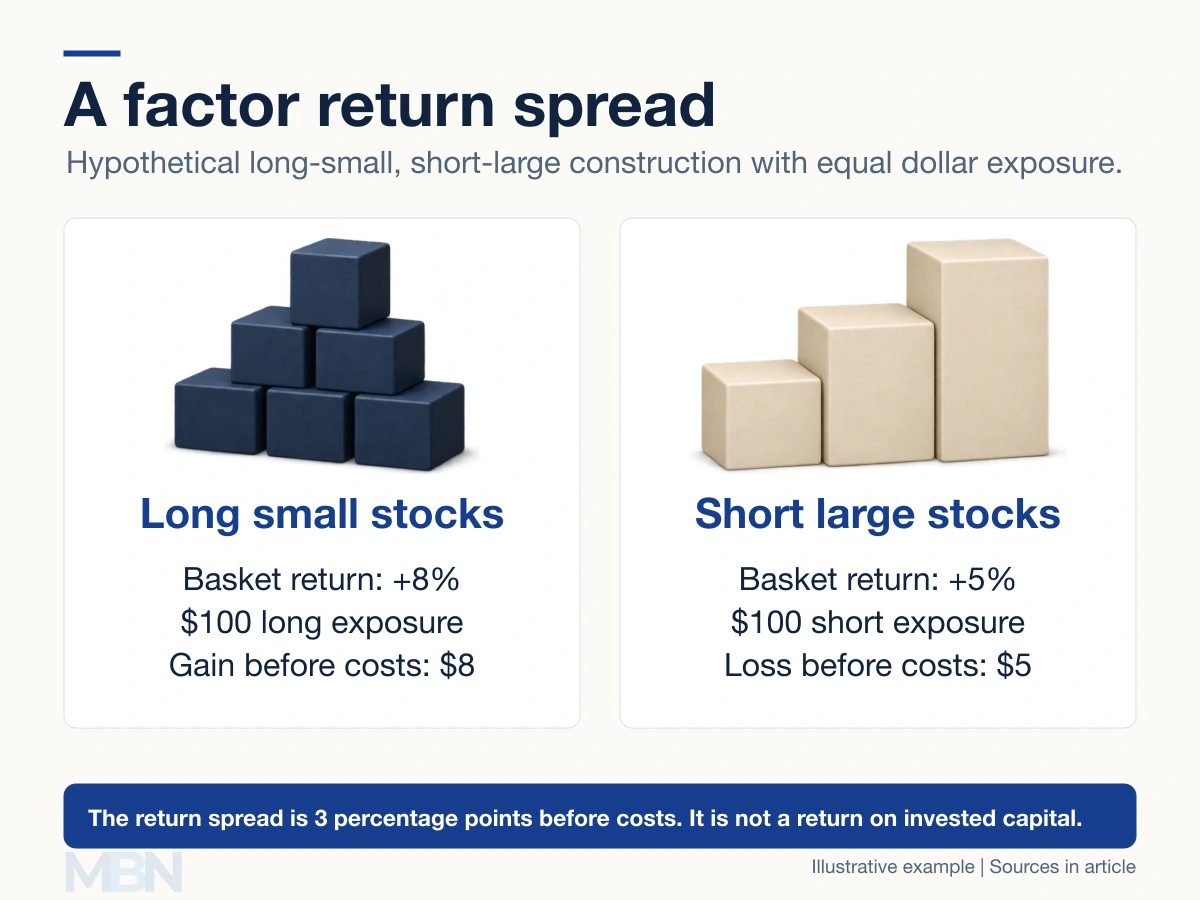
This spread is not automatically a 3% return on the investor’s capital. Collateral, leverage, financing and stock-borrowing costs affect an implementable strategy. The simplified example is not the full SMB construction.
Why outcomes can disappoint
Historical factor premiums can be negative over future periods. Estimated loadings may change, and portfolios intended to isolate one factor can retain unwanted exposures. Combining factors may diversify some risks, but correlations can change and losses can occur together. A factor label alone does not establish either diversification or superior performance.
Last checked and updated on November 11, 2026 by the MBN editorial team.