
A Wolfe Wave is used by traders to predict future price movements. It is a price action pattern consisting of up to five different waves that show supply and demand as price moves towards an equilibrium price.
Multiple contours on a chart reveal the inherent pattern of price movements found in all markets. The waves represent a number of points of supply and demand equilibrium that occur over time. They are led by a dominant wave that can give us an indication of future price movements.
A Wolfe Wave pattern may develop in time-frames ranging from one minute to a monthly chart. They all have two things in common:
- The are used to predict where price is heading.
- They can tell you when the price will get to where it is heading.
In the world of Forex (foreign exchange) speculation, traders first have to know how to spot a Wolfe Wave pattern when it is forming, and know at what point they have to trade, i.e. buy or sell, as well as what point they have to take profit and exit a trade.
Wolfe Wave helps predict equilibrium price
When identified correctly, Wolfe Waves are used to forecast the equilibrium price of an underlying security. The equilibrium price is where the supply of goods equals demand.
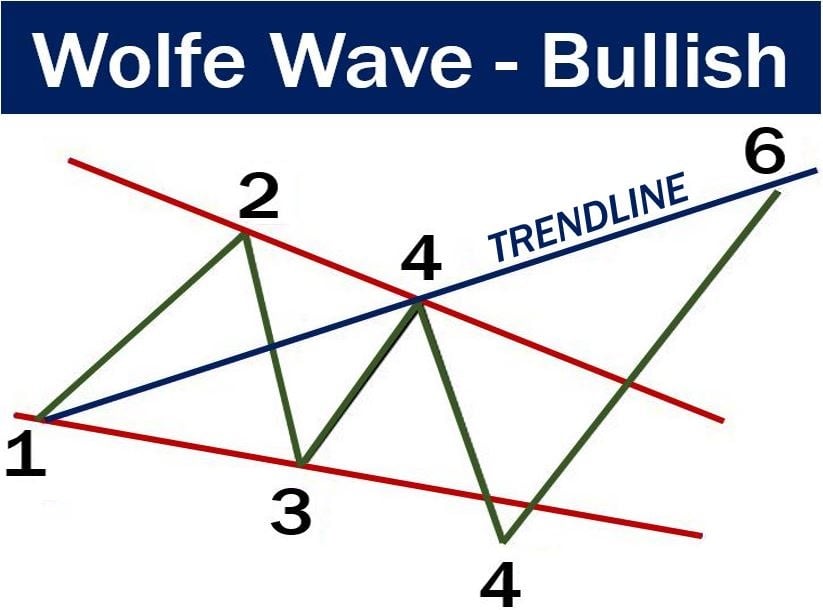
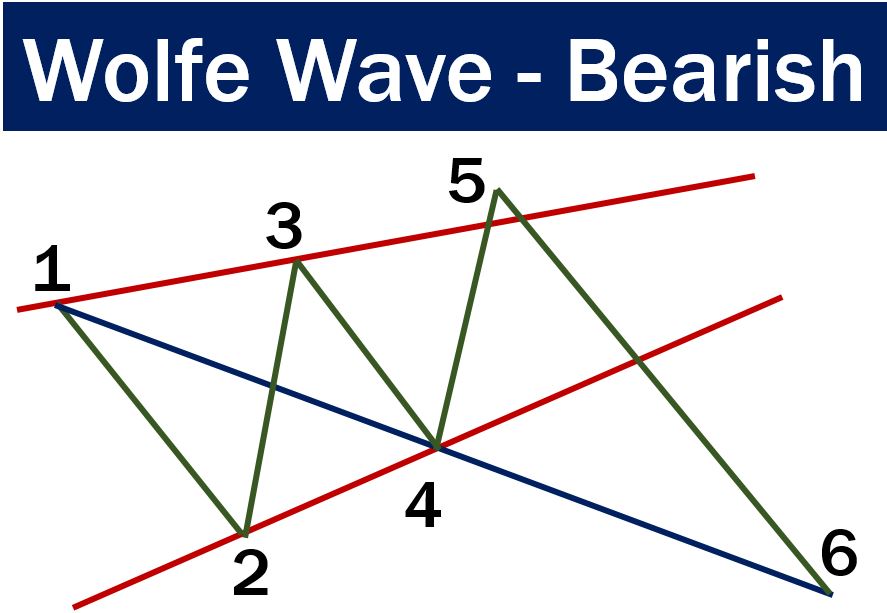
When trying to identify a Wolfe Wave, look out for the following features:
- Wave 3-4 must remain within the channel created by 1-2.
- Wave 1-2 is the same as 3-4, i.e. there is symmetry.
- The interval (time) between each wave is irregular.
- Wave 5 is greater than the trendline that waves 1 and 3 created, and is the entry point.
No psychology behind Wolfe Wave
The Wolfe Wave was discovered (not invented) by S&P trader Bill Wolfe twenty years ago. Mr. Wolfe suggests that the Wolf Wave is a naturally-occurring harmonic pattern that can be found all of the time, in all financial charts. There is no psychology behind it.