Photo by Venngage
When it comes to business reports, a timeline can be a powerful tool for visualizing data. They can help you track progress on goals, illustrate the order of events, and show how different aspects of your business are related.
To create a timeline, you can use one of the many online tools, such as a poster maker, to create graphic representations of data. You can also use Venngage’s timeline maker, which offers a variety of templates and customization options to make your timeline look professional.
Once you have your timeline tool, it’s time to start adding data. It is essential to consider what information to include, how much detail you need to provide, and identify the best way to represent the information visually.
Here are a few guidelines for using a timeline in your business report:
-
Use colors to code business information.
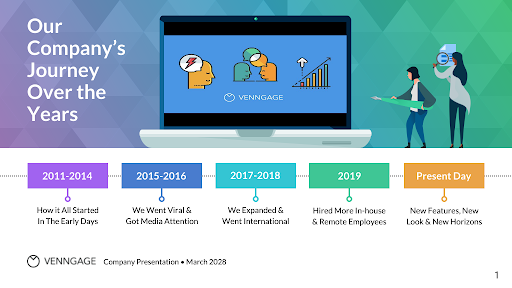
Colors can be beneficial in business reports. For example, you could use green to denote progress on a goal and red to denote areas of concern. These colors can help you to quickly and easily see how you are doing in different areas of your project. Additionally, you can use colors to code chronology. For example, you could use blue for events that happened in the past and yellow for events at present. This code can help you to keep track of time and ensure that you are on schedule. Ultimately, using colors to code business information can be a beneficial way to organize your thoughts and keep track of essential details.
-
Add annotations to call out important events or data points.
In business reports, analysts often use annotations to highlight important events or data points. As a timeline example, an analyst might create a timeline of a company’s financial performance, with annotations to indicate key milestones such as the launch of a new product line or the opening of a new factory.
The analyst can help readers understand the factors influencing the company’s bottom line by calling out these events. In addition, they can also use annotations to draw attention to positive or negative trends. For instance, if a company’s sales have been declining for several quarters, an annotation can help to bring this trend to the reader’s attention.
Ultimately, by making business reports more interactive and informative, annotations can play an essential role in assisting users in making better-informed decisions.
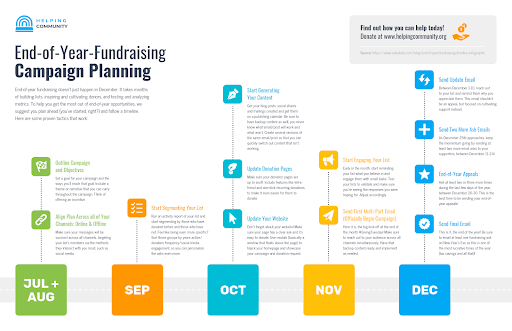 Photo by Venngage
-
Track progress over time.
A timeline is an essential tool for businesses, helping them to track progress and growth over time. One of the most popular methods is to use a historical events timeline. This type of timeline can be beneficial in showing the progression of your business and highlighting any significant milestones.
To create a historical events timeline, simply list out all of the crucial events that have occurred in your business, including both positive and negative milestones. Include each event’s date so you can easily track your progress over time. Once you have created your timeline, you can use it to present your business report in a more engaging and visually appealing way.
-
Illustrate cause and effect.
One way to visually represent information in a business report is through a graphical timeline. This type of timeline can help show how different aspects of your business are related. For example, a timeline can illustrate how changes in sales volume have impacted employee morale. Additionally, you can use a timeline to show how different elements of your business strategy have played out over time. A timeline can be a valuable tool for understanding the complex relationships between various aspects of your business.
-
Compare data sets.
In preparing business reports, a business timeline is a helpful way to compare data sets. By graphing business data on a timeline, businesses can find trends or identify areas of opportunity. For example, a company might use a timeline to compare sales figures from other months. Doing this can help the business to identify any seasonal trends that might be present. Additionally, companies can use a timeline to compare data sets from different geographical areas. Doing this can help businesses find new markets or understand how their products sell in other parts of the country.
-
Predict future trends.
Another use for business timelines is to predict future trends. By understanding how your business has grown over time, you can make informed predictions about where it is headed in the future. For example, if you have been tracking a decline in sales over the past few months, you might use a timeline to predict that this trend will continue in the future. Additionally, if you have been tracking an increase in customer complaints, you might use a timeline to indicate that this trend will continue in the future.
Using a timeline in your business report can be a great way to organize information and make complex topics easier to understand. By taking the time to create a timeline, you can ensure that your report is clear, concise, and easy to follow.
Sign up to Venngage today for a free account and begin creating your timeline.
Interesting Related Article: “6 Tips for Professional Online Presentations“