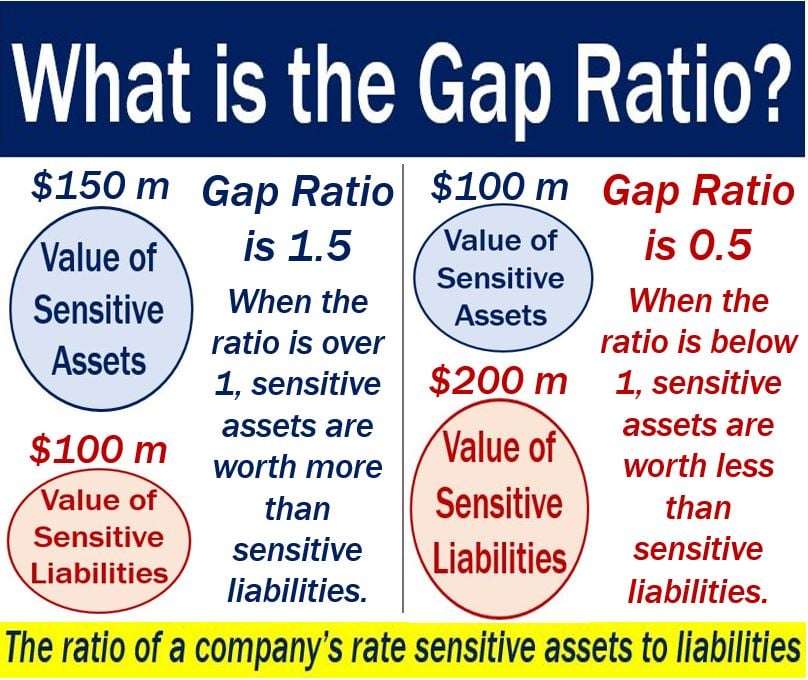
Gap ratio is the ratio of a company’s rate sensitive assets to liabilities. ‘Rate sensitive‘ means that the assets and liabilities rise or fall significantly when interest rates change. In other words, gap ratio is the measurement of a business’ short-term investments against short-term expenditure. The aim is to determine how much profit or revenue there is when investments become due.
A ratio of more than 1 suggests that there are more rate-sensitive assets than liabilities. Therefore, profits or revenue will probably rise as interest rates increase.
A ratio of less than 1, on the other hand, suggests the opposite.
Bankers and individuals who work in other financial institutions use this type of ratio the most.
According to The Free Dictionary by Farley, the gap ratio is:
“The ratio of a company’s rate-sensitive assets to its rate-sensitive liabilities. Rate-sensitive assets and liabilities are those likely to increase or decrease substantially in value due to changes in interest rates.”

Poverty ratio – many types
There are several types of gap ratios that economists and business people use. Below are the meanings of some of them:
Poverty gap ratio
The poverty gap ratio, poverty gap index, or PG index is the average of the ratio of the poverty gap to the poverty line. Statisticians express it as a percentage of the poverty line for a region or whole country.
It is a measure of poverty intensity. Economists and statisticians say the PG index is an improvement over the poverty headcount measure. The poverty headcount measure just counts all the individuals below the poverty line in a population. It considers them all as equally poor.
The poverty gap ratio, on the other hand, estimates poverty depth. It does this by considering how far, on the average, poor people are from that poverty line.
With the poverty gap ratios, it is possible to make meaningful comparisons. It also helps us determine whether regions are making progress in reducing poverty.
Poverty is the state of being poor. However, countries may have different definitions. Somebody who is ‘poor’ in Switzerland may not be poor in Chad.
Income gap ratio
Income gap ratios analyze how far below or above a certain income level people or households are.
For example, Statistics Canada gives the example of people living in a household with an income of $15,000 per year.
If the low income cut-off is $20,000, they would have a low income gap of $5,000. In percentage terms, their income gap ratio would be 25%.
According to Statistics Canada:
“In percentage terms, the [income] gap ratio would be 25%.4 The average (or median) gap ratio for a given population is the average (or median) of these values as calculated for each person.”
Wealth gap ratio
The wealth gap ratios show us the relationship between a country’s mean and median wealth.
For example, Channel News Asia says that Singapore’s mean wealth and median wealth are S$380,000 and S$140,000 respectively. 140,000 times 2.72 equals 380,000. Therefore, Singapore’s wealth gap ratio is 1 to 2.72.
Median wealth is the wealth that the person in the middle of the economic ladder has. Mean wealth is the average. In other words, you add up all the wealth and divide that by the number of people.
