
Montreal homes are the greenest – their greenhouse gas emissions are the lowest in the country – while those of Edmonton are the least green among Canada’s major cities, say two researchers from the University of British Columbia.
Their study gathered and analyzed census data over a 12-year span and then ranked cities according to how much CO2 (carbon dioxide) the average Canadian household with an annual income of CAN$81,000 in each city produced in one year from the combined use of natural gas, gasoline and electricity.
Sumeet Gulati, an Associate Professor in Environmental and Resource Economics, and and Juan Fercovic, a former graduate student in food and resource economics at UBC, wrote about their research in the academic journal Regional Science and Urban Economics.
 Average household GHG emissions in each city. (Image: news.ubc.ca)
They found that average greenhouse gas emission per household differed considerably from one city to another. For example, the average household in Montreal produces five tonnes of greenhouse gases (GHG) annually, compared to 20 tonnes per year for each household in Edmonton.
Montreal’s hydropower cleaner than Edmonton’s coal
Prof. Gulati said, regarding Montreal being Canada’s greenest city:
“Montrealers do well because of their supply of affordable hydropower, and their use of electric heating. Edmonton does poorly due to its extreme weather, low density and reliance on coal.”
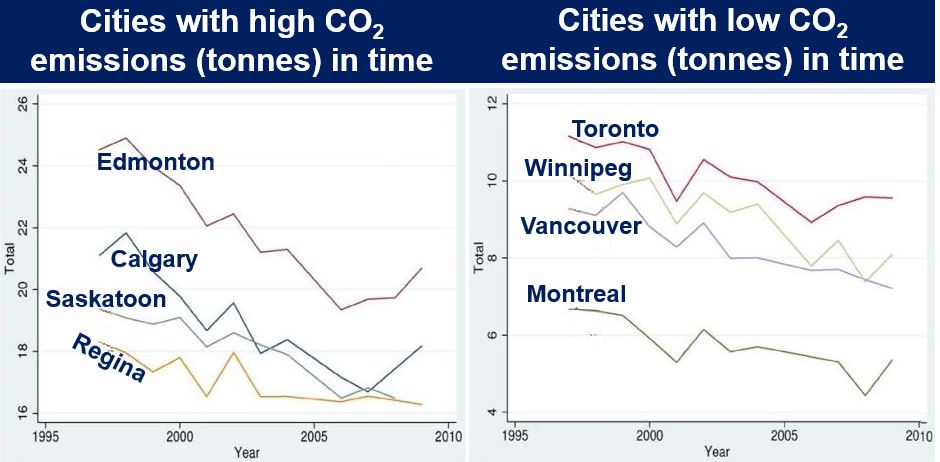 Total GHG emissions in tonnes from natural gas, electricity and gasoline consumption. (Image: news.ubc.ca)
Below is a list of average household CO2 emissions of seven cities in Canada:
– 5.4 tonnes – Montreal (greenest)
– 7.2 tonnes – Vancouver
– 8.1 tonnes – Winnipeg
– 9.6 tonnes – Toronto
– 16.3 tonnes – Regina
– 18.2 tonnes – Calgary
– 20.7 tonnes – Edmonton
Temperate Vancouver emits more GHG than Montreal
Prof. Gulati said he and Mr. Fercovic were surprised that Vancouver trailed Montreal for Canada’s greenest city. Vancouver has a much milder climate, but emits 7.2 tonnes of GHG annually per family – much more than Montrealers do.
The authors explained that Quebec’s expensive natural gas price is a major factor in keeping consumption down. Natural gas in British Columbia, on the other hand, is considerably cheaper, and is thus used in large quantities for home heating.
Overall, GHG emissions across the whole country have declined from 11.5 tonnes annually per household in 1997 to 9.7 tonnes in 2009.
Prof. Gulati said:
“We are using cleaner energy, and people are moving to cleaner compact cities.”
Factors that influence GHG emissions
How much GHG a household emits is influenced by where it is located, i.e. where a household is influences energy use and thus GHG emissions.
The following factors influence energy consumption:
– Weather – extremes of temperature increase demand for indoor climate control.
– Population density influences driving behaviour.
– The size of a house – a large house obviously requires more fuel than a small one.
– The age of a house – older houses tend to consume more energy.
– The source of the energy.
In an Abstract that describes the main paper, the authors wrote:
“Edmonton and Calgary have the highest associated emissions, due to their extreme weather, low density, and coal based electricity supply.”
“The average household across all cities (weighted by population share) experienced a decline in its predicted CO2 emissions from 11.49 tonnes per year in 1997 to 9.7 tonnes in 2009 (16% over 12 years). One of the reasons for this decline is that population growth was higher in cities where emissions fell faster.”
Citation: “Comparing household greenhouse gas emissions across Canadian cities,” Juan Fercovic and Sumeet Gulati. Regional Science and Urban Economics. 8th July, 2016. DOI: 10.1016/j.regsciurbeco.2016.06.010.
