Smartphone shipments declined by 9% in the fourth quarter of 2017 to 400 million units from 438.7 million shipments in the fourth quarter of 2016.
The drop is the biggest annual decline in smartphone history, according to statistics from Strategy Analytics.
The global smartphone market was significantly affected by a dip in demand in China market.
Demand for smartphones in China dropped by 16 percent annually.
Linda Sui, Director at Strategy Analytics, said:
“Global smartphone shipments declined 9 percent annually from 438.7 million units in Q4 2016 to 400.2 million in Q4 2017. It was the biggest annual fall in smartphone history.
“The shrinkage in global smartphone shipments was caused by a collapse in the huge China market, where demand fell 16 percent annually due to longer replacement rates, fewer operator subsidies and a general lack of wow models.
“However, on a full-year basis, global smartphone shipments grew 1 percent and topped an impressive 1.5 billion units for the first time ever.”
Apple overtook Samsung in the fourth quarter, boasting 19% global market share, despite shipments slipping by 1% annually from 78.3 million in Q4 2016 down to 77.3 million in Q4 2017.
Neil Mawston, Executive Director at Strategy Analytics, commented:
“Apple shipped 77.3 million smartphones worldwide in Q4 2017, slipping 1 percent annually from 78.3 million in Q4 2016. Despite robust iPhone X demand and an iPhone average selling price approaching an incredible US$800, we note global iPhone volumes have actually declined on an annual basis for 5 of the past 8 quarters.
“If Apple wants to expand shipment volumes in the future, it will need to launch a new wave of cheaper iPhones and start to push down, not up, the pricing curve. Samsung dipped 4 percent annually and shipped 74.4 million smartphones for 19 percent marketshare worldwide in Q4 2017, up slightly from 18 percent share a year ago.
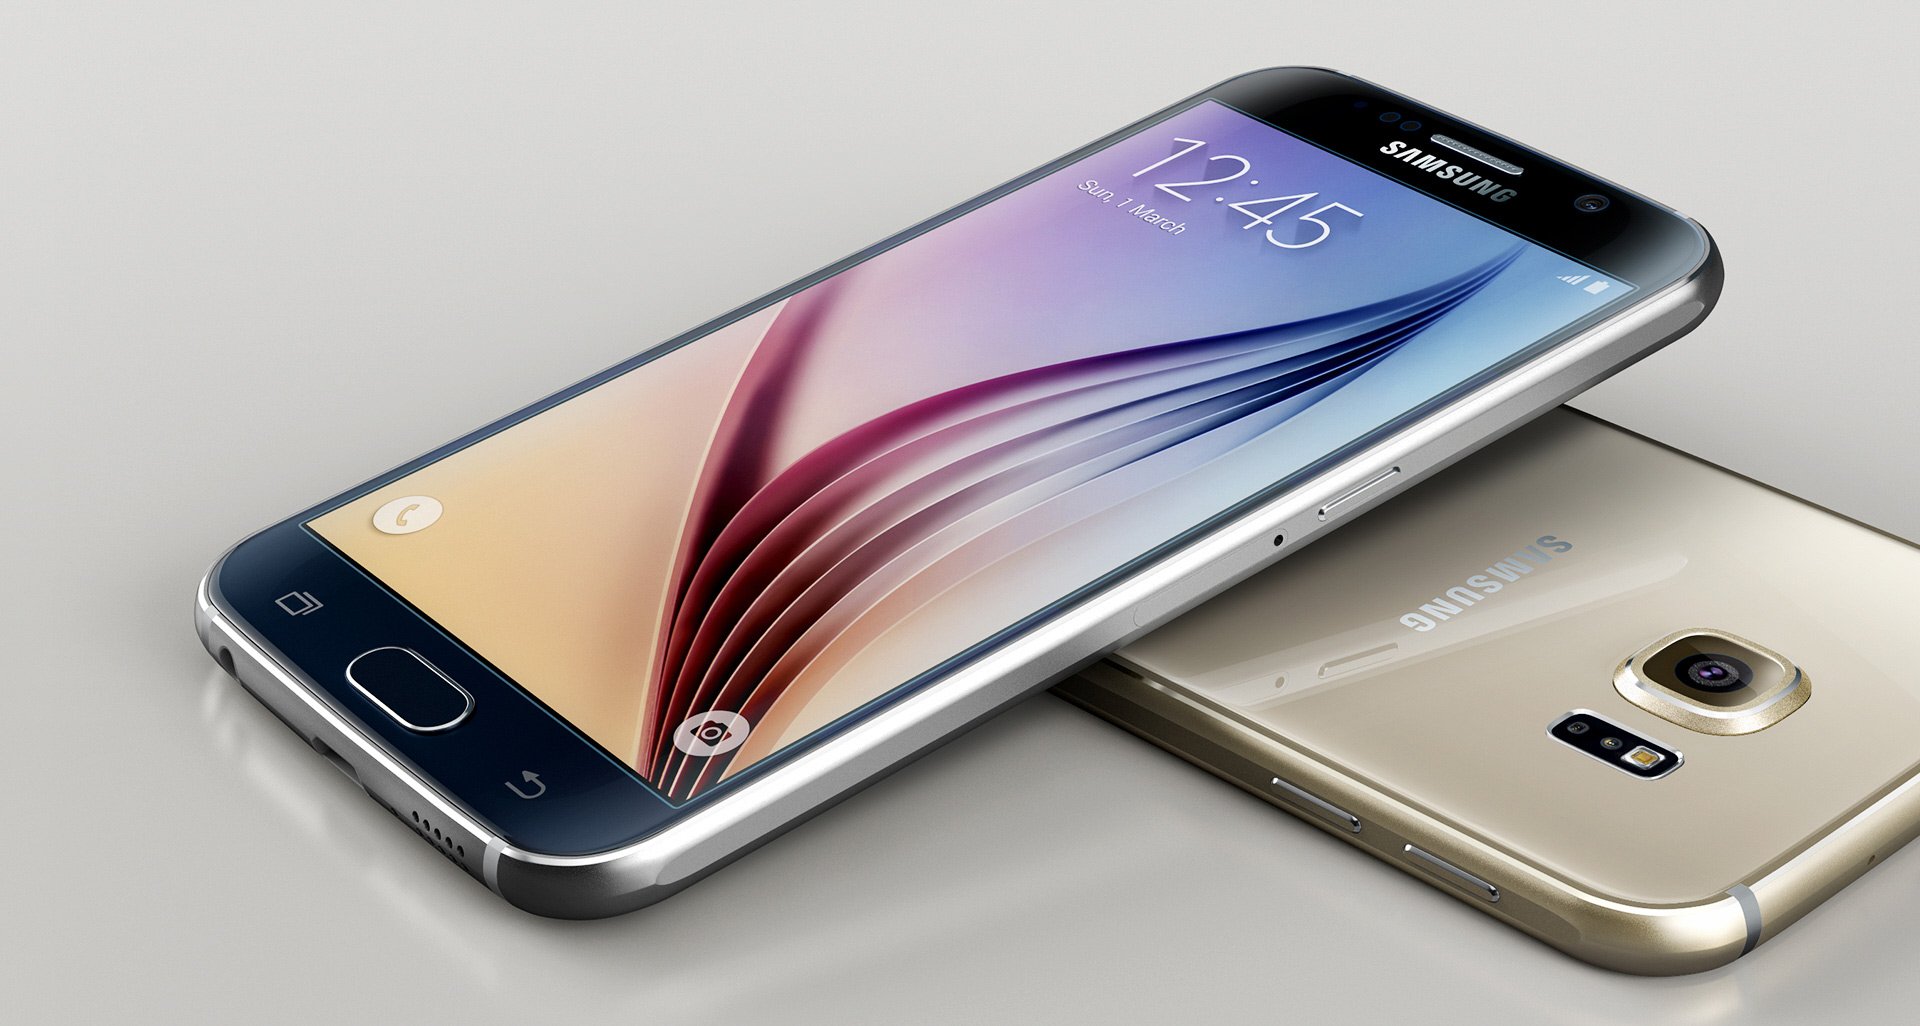
“Samsung is under pressure from Chinese rivals in some major markets, like China and India, but it remains by far the largest smartphone brand on a global basis, shipping an unmatched 317.5 million units in full-year 2017.”
The selling price is how much customers paid for a product. It contrasts with cost price, which is the amount a company paid its supplier.
To get the average selling price, we gather lots of prices of one product over a specific period and add them up. Then, we divide the total by the number of prices that we had gathered.

