Financial ratios or accounting ratios measure a company’s financial situation or performance against other firms. The ratios also measure against the industry average or the company’s past figures.
We can calculate the majority of ratios from data that exists in the financial statements.
Financial ratios are common in accounting. There are several standard ratios people use to evaluate the overall financial condition of a company.
Managers inside a firm, shareholders, or creditors may use these calculations. Financial analysts use financial ratios when comparing the strengths and weaknesses of several companies.

In some financial ratios, we use the market price of a company’s shares.
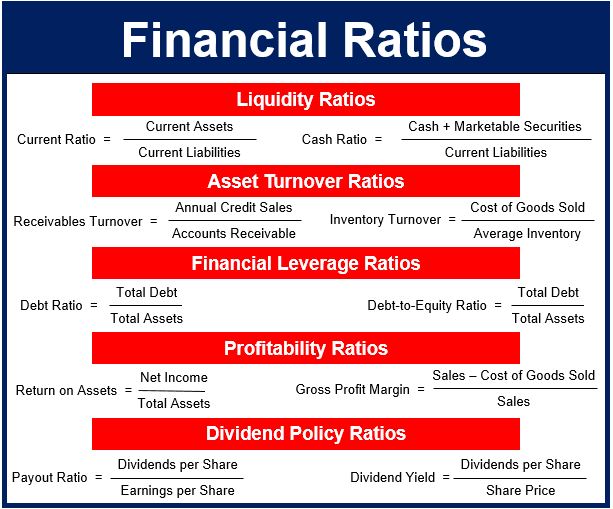
We categorize financial ratios according to their data source and the information they provide. Below are the five most common ratios:
Asset turnover ratios
We sometimes refer to these ratios as asset management ratios, asset utilization ratios, or efficiency ratios.
They give us an idea of how efficiently a business is utilizing its assets.
The two most common asset turnover ratios are inventory turnover and receivables turnover.
Dividend policy ratios
Dividend policy ratios help us determine a firm’s prospects for future growth. They also provide insight into a company’s dividend policy.
The two most common ratios are the payout ratio and dividend yield.
Financial leverage ratios
With financial leverage ratios, we can get a better idea of a company’s long-term solvency.
In contrast to liquidity ratios, which look at how a company copes with short-term assets and liabilities, financial leverage ratios measure how well the firm is using long-term debt.
In this category, the most common ratios are debt ratio and debt-to-equity ratio. To calculate debt ratio, for example, we divide a company’s total debts by its total assets.
Liquidity ratios
Liquidity ratios tell us about a company’s ability to meet its short-term financial obligations.
Banks that are considering (or already) extending short-term credit find this type of data very useful.
Profitability ratios
Profitability ratios give us an indication of how successful a company is at generating profits.
The most common calculations are return on equity, return on assets, and gross profit margin.
Financial ratios – reference point
NetMBA says that for a financial ratio to be meaningful you must have a reference point. We must compare it to historical values within the same company, or ratios of similar firms.
In other words, there must be a benchmark.
NetMBA adds:
“Most ratios by themselves are not highly meaningful. They should be viewed as indicators, with several of them combined to paint a picture of the firm’s situation.”
People usually use financial ratios to compare:
- one company against another (or others),
- one industry against another (or others),
- one point in time against another (or others) within the same company,
- a single company with the industry average.
Decimals and percentages
We can express a ratio as a decimal value (e.g. 0.10) or as a percentage value (e.g. 10%).
Some ratios, especially those that result in a figure of less than 1, always appear as percentages.
Ratios that result in a number higher than 1 appear as decimal numbers.
Using financial ratios to compare companies may be challenging. They are especially challenging for private firms that use different accounting methods.
The majority of public companies by law must use generally accepted accounting principles and are thus easier to compare.
Economic ratios
Some ratios refer to the whole economy. In such cases, we call them economic ratios. The import ratio, for example, gives us an idea of sovereign risk.
Import ratio is the ratio between one month’s worth of imports and the country’s total foreign exchange reserves.
