
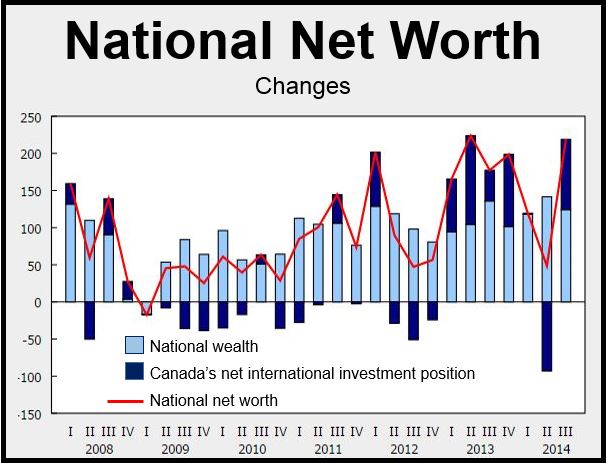
National net worth per capita (per head of the population) increased by 2.4% to $227,500 in the third quarter, Statistics Canada reported on Monday. National net worth grew by 2.8% to $8,117 billion.
The total value of non-financial assets in Canada’s economy, i.e. its national wealth, increased by 1.6% to $8,092 billion in Q3 2014, accounting for approximately half the growth in national net worth. The growth was driven mainly by price rises in residential and non-residential properties.
A $94.5 billion increase in the country’s international investment also contributed to the gain. At the end of Q3 2014, Canada returned a net asset position of $25.6 billion.
 Source: Statistics Canada.
The smaller net foreign debt was mainly due to a weaker Canadian dollar, which in local currency raised its international assets relative to the value of its international liabilities.
Households
After growing by 2.2% in the second quarter, household net worth in the third quarter increased by a more moderate 1.3%.
Non-financial assets, led by real estate price rises, were 1.8% up in Q3. Growth in financial assets was much more moderate at +0.2%. On a per capital basis, household net worth in Canada in the third quarter was $232,200.
The ratio of financial and non-financial assets stood at 120% at the end of Q3, which was lower than the previous quarter, because non-financial assets increased in value more strongly than financial assets.
Since 2009, when equity prices fell steeply relative to real estate and other non-financial assets, the value of financial assets has experienced more frequent bouts of considerable growth. Consequently, the ratio of financial and non-financial assets has been rising.
Canadian households borrowed a total of $27.4 billion in Q3 2014, mainly in the form of mortgages. Consumer credit, mortgage and non-mortgage loans (household credit market debt) increased by 1.5% to $1,805 billion.
Consumer credit debt grew by 0.9% to $515 billion, while mortgage debt increased by 1.8% to $1,171 billion.
Disposable income (spare cash) grew more slowly than household credit market debt in Q3 2014. Consequently, leverage, as measured by household credit market debt to disposable income, came in at 162.5% in the third quarter, compared to 161.5% in Q2. In other words, there were $1.63 of credit market debt for every dollar of spare cash in Canadian households.
A person’s net worth is calculated by adding up all his or her assets, minus total liabilities.
Statistics is the science of collecting and analyzing data – specifically numerical data – in large quantities.