

From 2000 to 2011, American inequality widened, says the Census Bureau. Median household net worth increased among the top 40% (top two quintiles) of the country but declined among the bottom 60% (bottom three quintiles). A quintile represents 20% of all households.
Census Bureau economist Alfred Gottschalck said:
“The types of assets that households hold may vary. Therefore, business cycle changes over time may affect households differently based on their net worth quintile and demographic characteristics.” (The term ‘business cycle’ refers to fluctuations over time in the economy from expansion to contraction, what many call ‘boom and bust’.)
Rich richer – poor poorer
Median household net worth among the bottom quintile declined by $5,124, according to “Distribution of Household Wealth in the US: 2000 to 2011.”
Among the top quintile households, however, median net worth rose by 10.8% or $61,379 during the 11-year period.
Household median net worth among the top 20% was 39.8 times greater than the second lowest quintile in 2000, compared to 86.8 times higher eleven years later.
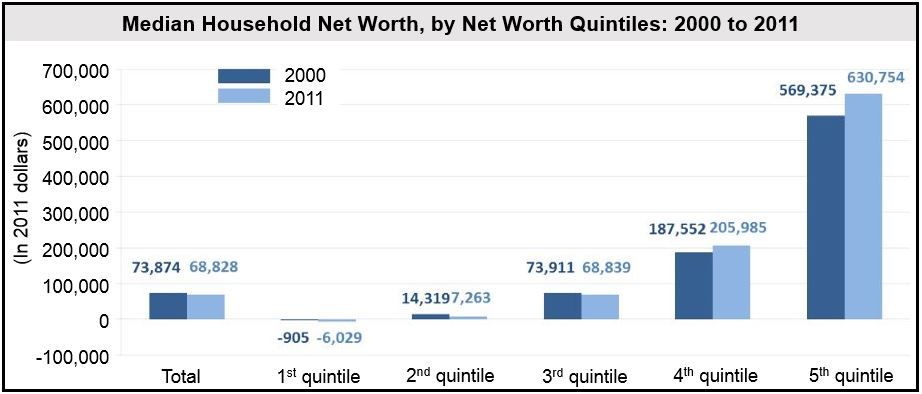
(Data source: US Census Bureau)
Gap widened within same demographic groups
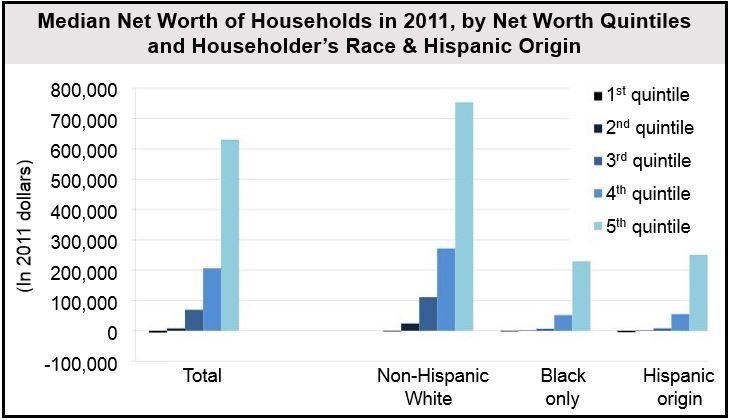
The Census Bureau report informed that inequality has also widened in households sharing the same demographic characteristics, such as academic level, race, and age.
Household median net worth among non-Hispanic whites in the top quintile was 21.8 times greater than among non-Hispanic whites in the second-lowest quintile at the beginning of this century, compared to 31.5 times higher in 2011.
For African-Americans, the ratio widened from 139.9 to 328.1, and from 158.4 to 220.9 for Hispanics.
Inequality between demographic groups
During the same period, the wealth gap between groups with different demographic characteristics also widened.
In 2000, the ratio of median net worth of non-Hispanic whites to that of African-Americans stood at 10.6, compared to 17.5 eleven years later.
The ratio of non-Hispanic whites to Hispanics increased over the same period from 8.1 to 14.4.
Census Bureau economist Marina Vornovitsky said:
“However, when looking at the highest quintile for these groups, we see that blacks experienced higher relative increases in median net worth than non-Hispanic whites and Hispanics.”
(Data source: US Census Bureau)
Among different races in the top quintile, median net worth from 2000 to 2011 increased by:
- Non-Hispanic whites: 11.9% to $754,244.
- Hispanics: 17.9% to $250,462.
- African-Americans: 62.8% to $229,041.
Inequality – a long-term OECD problem
According to the OECD, inequality has been a growing problem in all member states for the past thirty years.
An OECD report showed that since the early 1980s, the top 1% earners continue capturing a progressively greater share of overall income growth.
Since 1981, America’s richest 1% have captured 47% of overall income growth, and 37% in Canada.
Even in Scandinavian countries, which are supposed to be more egalitarian, the top 1% richest people’s share of each country’s wealth increased by 70%.
In April 2014, a Harris Poll found that 54% of Americans see economic inequality as a major problem today.
New jobs paying less: a presentation at the US Conference of Mayors in earlier this month showed that jobs gained since the Great Recession pay 23% less than jobs lost during the economic downturn. The average annual pay of jobs lost during the recession was $61,637, compared to jobs gained, which only pay $41,171.
