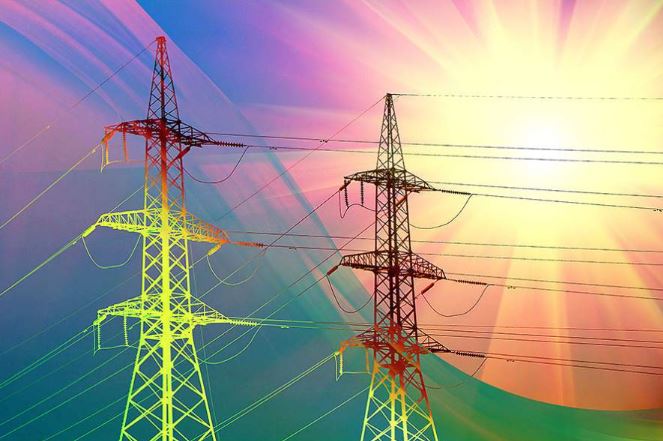
Climate change will stress the power grid more than the power industry has estimated, two researchers say. Specifically, they looked at long-term demand for electricity.
Sayanti Mukherjee and Roshanak Nateghi wrote about their study and findings in the journal Risk Analysis (citation below).
Sayanti Mukherjee is an Assistant Professor of Industrial and Systems Engineering in University at Buffalo’s School of Engineering and Applied Sciences. Roshanak Nateghi is an Assistant Professor at Purdue University, jointly appointed between Industrial Engineering and Environmental and Ecological Engineering.
Electricity regulators and providers use models for medium- and long-term energy forecasting. The authors describe the limitations of these models.
They also write about a new model that includes key climate predictors that they claim presents a more accurate view of future demands. Specifically, how climate change will alter future demand for electricity. Key climate predictors include, for example, extreme maximum temperature and mean dew point temperature.
Climate change
Climate change refers to the long-term shift in our planet’s weather patterns and average temperatures.
We also use the term global warming with the same meaning, but only when temperatures are rising.
The definition of climate change, unlike global warming, also includes long-term declines in temperature. At the moment, Earth’s average temperatures are rising. Climate change’s meaning includes weather patterns, such as droughts, hurricanes, heatwaves, cold spells, etc. Global warming does not.
Current power grid energy demand models
Regarding energy demand models, Prof. Mukherjee says:
“Existing energy demand models haven’t kept pace with our increasing knowledge of how the climate is changing.”
“This is troublesome because it could lead to supply inadequacy risks that cause more power outages, which can affect everything from national security and the digital economy to public health and the environment.”
Prof. Roshanak added:
“The availability of public data in the energy sector, combined with advances in algorithmic modeling, has enabled us to go beyond existing approaches that often exhibit poor predictive performance.”
“As a result, we’re able to better characterize the nexus between energy demand and climate change, and assess future supply inadequacy risks.”
Current models’ limitations
The vast majority of climate scientists believe that global temperatures will increase throughout this century. This will lead to increased demand for electricity from the power grid as air conditioners stay switched on for longer.
MARKAL is one of the most common energy modeling platforms. Power grid experts use it to predict future electricity demand. The term MARKAL comes from MARKet and ALlocation. The problem with MARKAL is that it does not consider climate change variability.
NEMS, which stands for the National Energy Modeling System, is another common energy-economic model. NEMS does consider the climate. However, this model is limited to heating and cooling degree days.
Measuring cooling and heating degree days
A heating degree day is a day when the average temperature is greater than 18 °C (65 °F). A cooling degree day is when the average temperature is less than 18 °C
There are many ways to measure the cooling and heating degree days. We most commonly add the day high temperature to its low temperature. We then divide the sum by two.
A high of 30 °C and a low of 20 °C, for example, results in an average temperature of 25 °C.
Approach should consider time
The trouble with this approach, Prof. Mukherjee points out, is that it does not take into account time.
What if, for example, it was 30 °C for 22 hours and 20 °C for just two hours? With this approach, we would still get an average temperature that day of 25 °C.
Prof. Mukherjee says:
“Moreover, choice of the accurate balance point temperature is highly contentious, and there is no consensus from the research community of how to best select it.”
The key is the dew point temperature
To address these limitations, the researchers studied several weather measurements. They found that the best predictor of growing energy demand is the dew point temperature.
The dew point temperature is the temperature at which the air is saturated with water vapor.
Using the extreme maximum temperature for a month is also a good predictor. However, the mean dew point temperature is the best predictor, the researchers say.
Professors Nateghi and Mukherjee combined these climate predictors with three other categories – weather data, socioeconomic data, and the sectors consuming the energy. The sectors consuming the energy include, for example, businesses, households, and industry.
Residential sector
After applying the model to the state of Ohio’s power grid, the researchers found that the residential sector is the most sensitive. Specifically, sensitive to climate variabilities.
In residential areas, it did not take much of a temperature change to stress the power grid significantly. Electricity demand could increase by up to 20% with a moderate rise in dew point temperature. With a severe rise, the prediction jumped to forty percent.
The Public Utility Commission of Ohio (PUCO), on the other hand, predicts a residential demand increase of 4% up to 2033. PUCO does not take into account climate change in its models.
Commercial and industrial sectors
In the commercial sector, where the authors predict a possible increase in demand of 14%, PUCO predicted just 3.2%.
Even though the industrial sector is the least sensitive to temperature variability, demand could still exceed projections, the authors wrote.
Winter months
The variations between the models are smaller when predicting demand during the winter months. Relatively few Ohio residents make demands on the electrical power grid to heat their homes.
Even though the study focused on Ohio, we can apply the model to other states, the authors say.
To communicate results, the authors used heat maps. Heat maps provide an immediate visual summary of the data by colors. The aim, they say, is to better inform power grid personnel and other decision-makers with accurate information. The data must also be easy to understand.
What is the power grid?
The power grid is an interconnected network for delivering electricity from power stations to consumers. We also call it the electricity grid. The power grid consists of:
– Power stations that generate electrical power.
– High-voltage transmission lines that carry electricity from distant sources to demand centers.
– Distribution lines that connect customers.
Citation
“A Data‐Driven Approach to Assessing Supply Inadequacy Risks Due to Climate‐Induced Shifts in Electricity Demand,” Sayanti Mukherjee and Roshanak Nateghi. Risk Analysis. First published: 24 September 2018 https://doi.org/10.1111/risa.13192.