

For the first time since 2006, the US poverty rate fell in 2013 as more Americans moved from part-time to full-time work – the number of people with full-time, year-round jobs in 2013 was 2.8 million higher than in 2012.
However, there was no statistically significant change in the total number of Americans living in poverty or real median household income, says the US Census Bureau, which published figures compiled from data gathered in the 2014 Current Population Survey Annual Social and Economic Supplement.
Mississippi posted the highest level of poverty in America, at 22.5%.
Incomes in 2013 remained virtually unchanged from the year before, except for the oldest and youngest Americans, for the second successive year.
Households headed by people aged 15 to 24 saw incomes rise by 10.5% in 2012, while those of households headed by people aged 65+ years grew by 3.7%.
Recession damage lingers
Although US stock prices have reached record highs since the recession, the Census Report shows that the damage caused by the housing bubble burst and financial crisis still lingers.
The childhood poverty rate, i.e. the poverty rate for US kids under 18 years of age, declined in 2013 compared to 2012 – the first drop since the beginning of the century.
In 2013, the US official poverty rate stood at 14.5%, down from 15% the year before. The US Census Bureau added that the “45.3 million people living at or below the poverty line in 2013, for the third consecutive year, did not represent a statistically significant change from the previous year’s estimate.”
Median annual household income increased by 0.3% ($180) last year, to an inflation-adjusted $51,939. Median household income is a middle level, with half above and half below the middle line.
The proportion of US citizens with no health insurance coverage dropped to 13.4% last year.
Average incomes are still relatively low, about 8% below the level of 2007 at the start of the recession, and almost 4% below the level at the end of it (2009). From 1991 to 2000, the previous expansion period, incomes grew by 13%.
In an official statement, the White House wrote:
“There is reason to believe that this progress (poverty reduction) has continued into 2014, as the labor market has strengthened and millions have gained health insurance coverage. At the same time, the data also offer a clear illustration of the large amount of work that remains to strengthen the middle class in the wake of the worst recession since the Great Depression.”
“(The President) will continue to push Congress to take constructive steps that invest in job creation, boost wages, and ensure equal pay for equal work.”
The Great Depression followed the Wall Street Crash in October 1929, and lasted for most of the 1930s.
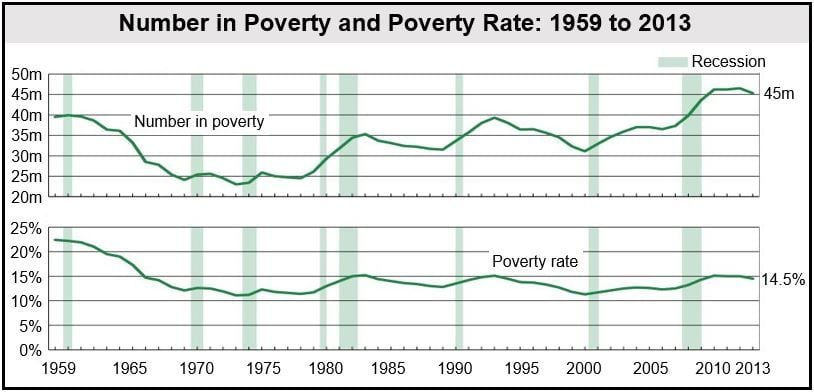
(Data Source: US Census Bureau)
The Washington Post quoted Sheldon Danziger, president of the Russell Sage Foundation, who said “The good news is that more people are working full time. The bad news is, for the typical worker, wages are just keeping up with inflation.”
US wealth gap grows
At the beginning of September, the US Federal Reserve reported that the wealth gap in the United States has widened, with the wealthiest Americans making 10% pre-tax income gains during the economic recovery, compared to median earnings, which have declined.
The Federal Reserve’s Survey of Consumer Finances found that median income adjusted for inflation from 2010 to 2013 rose by 2% to $223,200 for the top 10% richest households. For the bottom 60%, incomes fell considerably, as they had done from 2007 to 2010.
The authors of the Survey say that the growing wealth gap in the US is due to the changing nature of work today. The labor market has grown at the extremes, with new employment being created faster at the highest and lowest skill levels, but not in the middle.
A decade of growing inequality
In a previous report published by the Census Bureau in August, the authors explained that from 2000 to 2011, inequality in the US widened.
Median household net worth among the top 40% wealthiest of the nation increased, but for the bottom 60%, their net worth fell.
Alfred Gottschalck, an economist at the Census Bureau, said:
“The types of assets that households hold may vary. Therefore, business cycle changes over time may affect households differently based on their net worth quintile and demographic characteristics.” (The ‘business cycle’ refers to periods of growth and contraction in a national economy)
Among the bottom 20%, median household net worth fell by $5,124, while for the top 20% it increased by $61,379 from 2000 to 2011.
A Harris Poll found that 54% of Americans believe inequality in their country today is a “major problem”, while 79% see it as “a problem”. For the last two years, US citizen’s opinions about inequality has not changed much – in 2012 eighty percent saw it as “a problem”.
Thirty-six percent of people identifying themselves as Republicans see inequality as a “major problem”, compared to 55% of Independents and 70% of Democrats.
Global slowdown + widening inequality forecast
A study carried out by the OECD forecasts a worldwide economic slowdown plus widening inequality over the next three to five decades. The authors believe that current global GDP growth rates will weaken.
As lifespans increase and the emerging economies’ GDPs start slowing down, the authors see growth rates decelerating to 2.4% annually from 2050 to 2060.
The OECD says inequality has persisted in most countries for the last thirty years, with the 1% richest individuals capturing a progressively larger slice of the global wealth cake.
How the governments of the rich nations and the United Nations define poverty varies considerably. The UN says that a poor person is one who earns less than $1.25 per day.
