
An active portfolio strategy uses investment judgment to choose holdings, their weights and sometimes their timing in pursuit of a stated objective. It may aim to outperform a benchmark, generate income, manage risk or provide a particular exposure. Outperformance is an objective, not a guaranteed result.
A portfolio is a collection of investments. A benchmark is a reference against which its results can be assessed. An active US large-company equity portfolio might, for example, use the S&P 500 as its comparison.
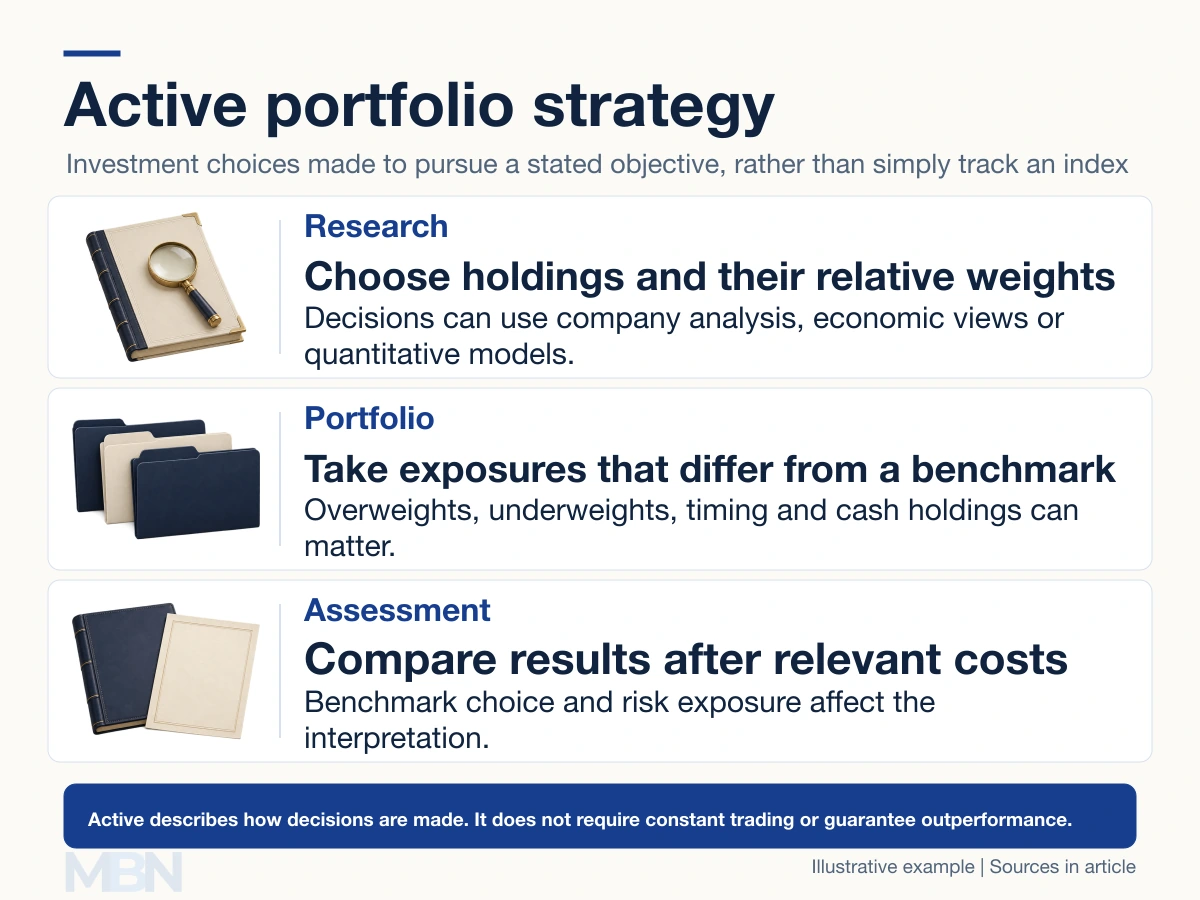
What makes the strategy active?
The SEC’s active-fund definition emphasizes an adviser’s role in constructing and managing a portfolio. Decisions can include selecting securities, changing sector exposures, varying bond maturities or holding cash.
An overweight means a larger allocation than the benchmark; an underweight means a smaller one. If technology represents 25% of a hypothetical benchmark but 30% of a portfolio, the portfolio has a five-percentage-point overweight.
Active management does not necessarily mean frequent trading. A manager can choose to hold an investment for years. Conversely, a passive fund seeks to track a specified index and may trade when that index changes or to manage investor flows.
How research informs the choices
A top-down approach starts with the economic environment, regions or sectors before selecting individual investments. A bottom-up approach starts with companies, their finances, competitive position and valuation. Starting with a company does not mean ignoring interest rates or the wider economy.
Quantitative approaches use defined models and data. Human judgment, algorithms and mixed approaches can all be active. A sophisticated model does not by itself establish that its forecasts work.
Return also differs from yield. Total return includes price changes and income; a quoted income yield relates a payment stream to an investment value. The two should not be used interchangeably.
Why costs and risk matter
Research, management fees, trading spreads and market impact can reduce returns. Higher turnover can also create tax consequences, depending on the investment and jurisdiction. The SEC’s index-fund bulletin discusses differences between active and passive management and their costs.
Suppose a $10,000 portfolio earns $1,000 before costs, a 10% gross return. Assumed costs of $150 leave $850, or 8.5%. A benchmark returning 9% would then outperform it by 0.5 percentage points.
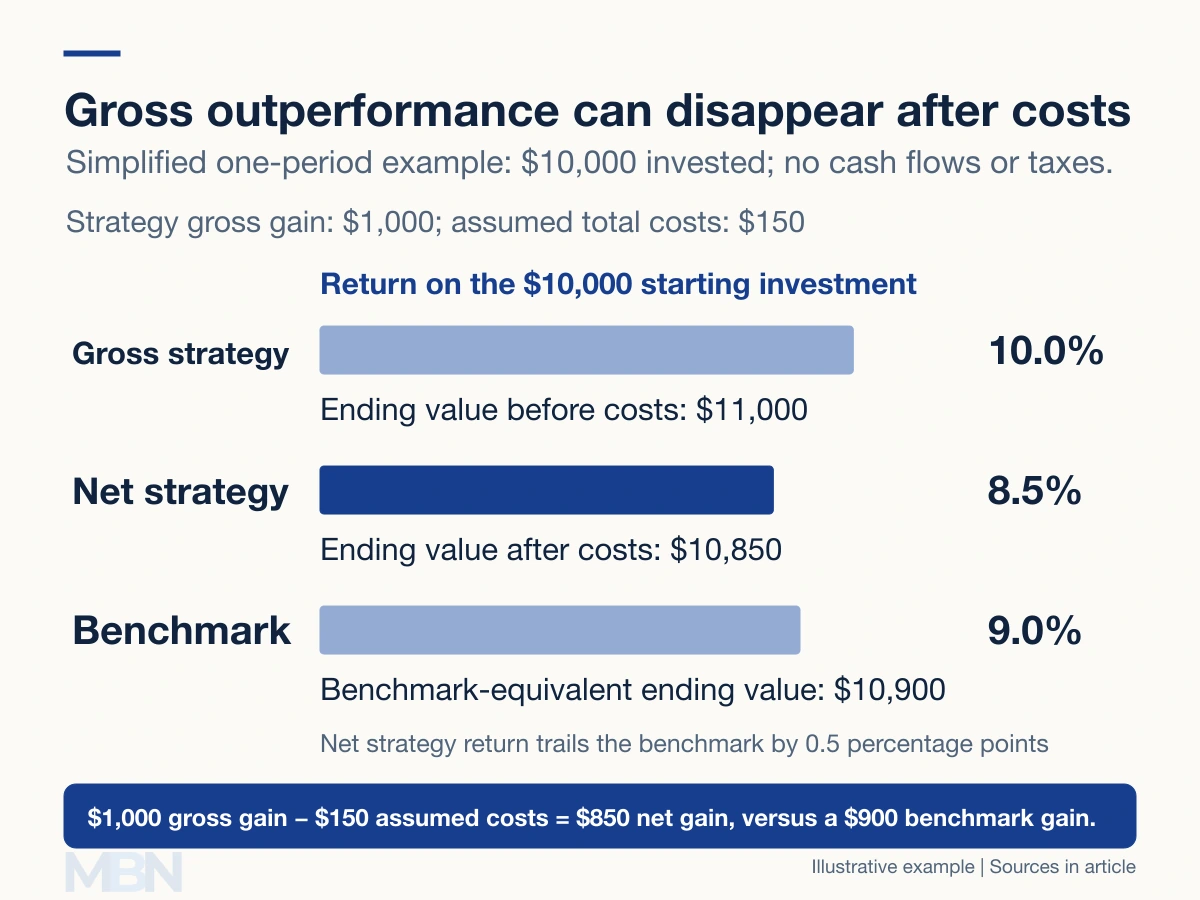
A benchmark index itself has no fund management fee. A product that tracks it has its own costs. Comparisons also need the same period, currency, income treatment and relevant risk exposures.
What performance evidence shows
The SPIVA US Year-End 2025 scorecard reported that 79% of active large-cap US equity funds underperformed the S&P 500 in 2025. That is a specific category and period, not a result for every active strategy or future year.
SPIVA’s framework accounts for funds that disappear, reducing survivorship bias, which arises when only surviving funds are counted. A strong historical record can reflect skill, risk or luck; it does not establish that future outperformance will follow.
Last checked and updated on November 11, 2026 by the MBN editorial team.