
A disruption at the Port of Los Angeles could cause production losses across inland manufacturing states, according to research modeling America’s freight and industrial networks. Alternative routes can limit the damage, but their spare capacity eventually runs out.
The study in Multimodal Transportation connects delayed deliveries with the industries that depend on them. Its findings are simulations, rather than measured losses from a particular port closure.
That approach helps explain why the biggest commercial exposure may sit far from the waterfront. A factory can have working machinery and available employees, yet lose production because one imported component has not arrived.
What is a cascading supply chain disruption?
A cascading disruption occurs when a problem at one point in a supply network creates problems elsewhere. A delayed component can hold up a manufacturer’s output, which then leaves another business waiting for the product it needs.
For example, a machinery producer missing an imported part might be unable to finish an order. Its customer could then postpone installing equipment. This is an illustration of the mechanism, not an incident documented by the researchers.
Freight networks can transmit the problem too. Redirected containers increase demand at other terminals and on connecting roads or railways. Those alternatives have limits, even if they were unaffected by the original event.
A gateway connects businesses well beyond California
Los Angeles handled about 10.2 million twenty-foot equivalent units in 2025, according to the port’s January account of its annual results. It remained the country’s busiest container port.
A twenty-foot equivalent unit, or TEU, measures container capacity. A standard 40-foot container counts as two TEUs, so the figure is not a count of individual boxes.
The port receives finished goods as well as materials and components. Trucks and trains carry them into supply chains serving other states. Measuring containers waiting at a terminal therefore captures only one part of a disruption’s consequences.
The research team, including Vanderbilt University researchers, modeled freight movements and production relationships across the 48 contiguous states and 15 broad sectors. It combined federal freight data with Bureau of Economic Analysis industry accounts.
One part of the model followed routing, congestion and inventory use. Another calculated how delivery shortfalls could constrain interconnected industries over a 52-week period.
Inventory can buy time while routes fill up
The simulations identified manufacturing and transportation-related activities as particularly exposed. Manufacturing losses extended to states including Texas, Illinois, Indiana and Ohio, alongside California.
Physical distance offered less protection than independence from the affected supply network. A nearby business buying locally could face less exposure than an inland manufacturer dependent on freight passing through Los Angeles.
Inventory changes the timing. A company holding several weeks of a critical component may continue producing while deliveries are delayed. A company with little stock can encounter the same shortage much sooner.
Maintaining reserves has a cost, however. Storage, insurance and money committed to stock all compete with other uses of cash. Our explanation of why profitable businesses can run out of cash describes how inventory can absorb funds before a sale produces a payment.
Alternative routes introduce a similar trade-off. Spare terminal or rail capacity may look underused during normal operations, yet become valuable when traffic must move elsewhere.
The researchers found that losses could rise disproportionately as disruption intensified and alternatives became congested. Twice the initial disruption need not mean twice the production loss.
Better routing cannot create unlimited capacity
The team also tested reinforcement learning, a method in which software learns which decisions improve an outcome. In the model, it adjusted incentives or conditions supporting shifts between transport modes.
It did not independently control every shipment. The approach reduced simulated losses under some conditions, but its benefits weakened as alternative infrastructure approached its capacity limits.
Those results do not establish what an operating port would achieve with the same software. Aggregated industries, assumptions about inventories and routing, and the characteristics of Los Angeles all influence the estimates.
For a manufacturer, a practical starting point is to trace the components that could stop production. A second supplier may offer little protection if both suppliers use the same congested gateway. An alternative route is useful only if it can accept the shipment when needed.
The port may be thousands of miles away. The relevant question for the factory is how many days its production line can keep running without the next delivery.
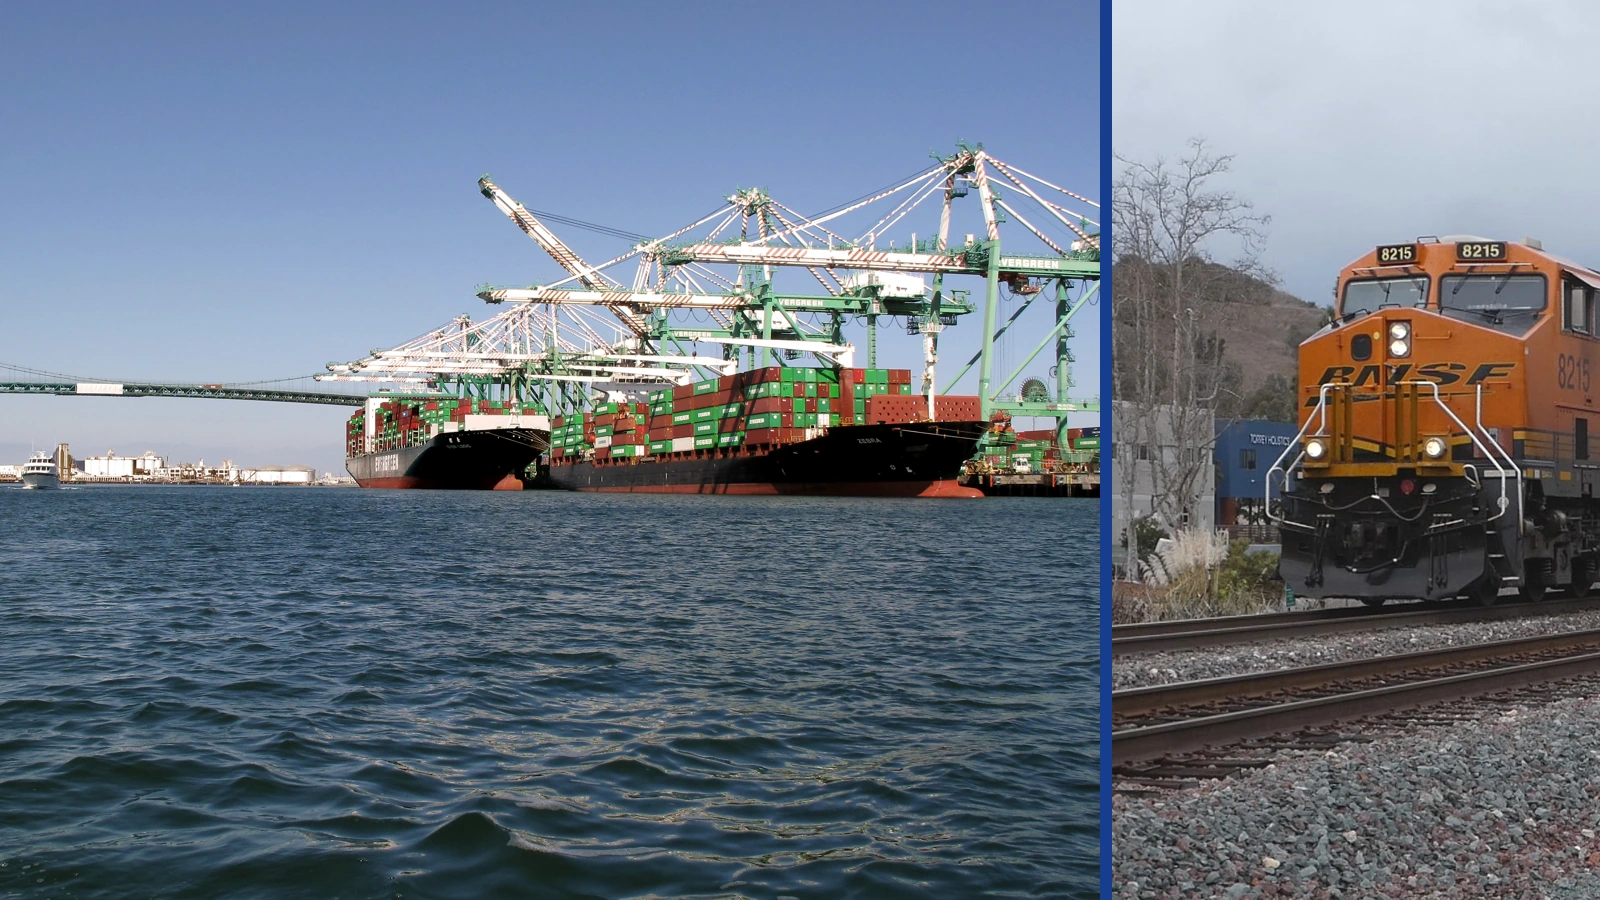
Cover: Container ships at the Port of Los Angeles in 2021 and a BNSF freight train in San Diego in 2023. Neither photograph depicts a disruption modeled by the researchers. Photographs by Downtowngal (CC BY-SA 4.0) and Austin Ring (CC BY-SA 4.0). Cropped and combined. Composite licensed CC BY-SA 4.0.
