

New research suggests financial AI may be more useful when it is trained to build stronger portfolios, rather than simply reduce forecasting errors.
Artificial intelligence can process vast amounts of market data in seconds, identify patterns and estimate how asset prices may move. That can be valuable. It still leaves a harder question: what should an investor actually do with the forecast?
This gap is the focus of a study by Yoontae Hwang of Pusan National University and Stefan Zohren of the University of Oxford. The researchers developed an investment model called the Signature-Informed Transformer, or SIT. Their central argument is simple. A model trained to reduce forecasting errors may still build a weak portfolio because forecasting and allocating capital are different jobs.
Pusan National University says the work was accepted for ICML 2026. The full paper and the researchers’ public implementation are available online.
Prediction and decision-making are different problems
At first glance, more accurate market predictions should produce better investment returns. In practice, a forecast is only one input into a much larger decision.
A forecasting model estimates how individual assets may perform. A portfolio system must decide how much money to place in each asset. It also has to consider volatility, diversification, relationships between assets, drawdown risk, liquidity, trading costs and investment rules.
Small forecasting errors can become much larger portfolio errors. An optimizer may react strongly to a slight difference between two predicted returns and place too much money in one asset. A model can therefore score well on average prediction error while still producing a concentrated or unstable portfolio.
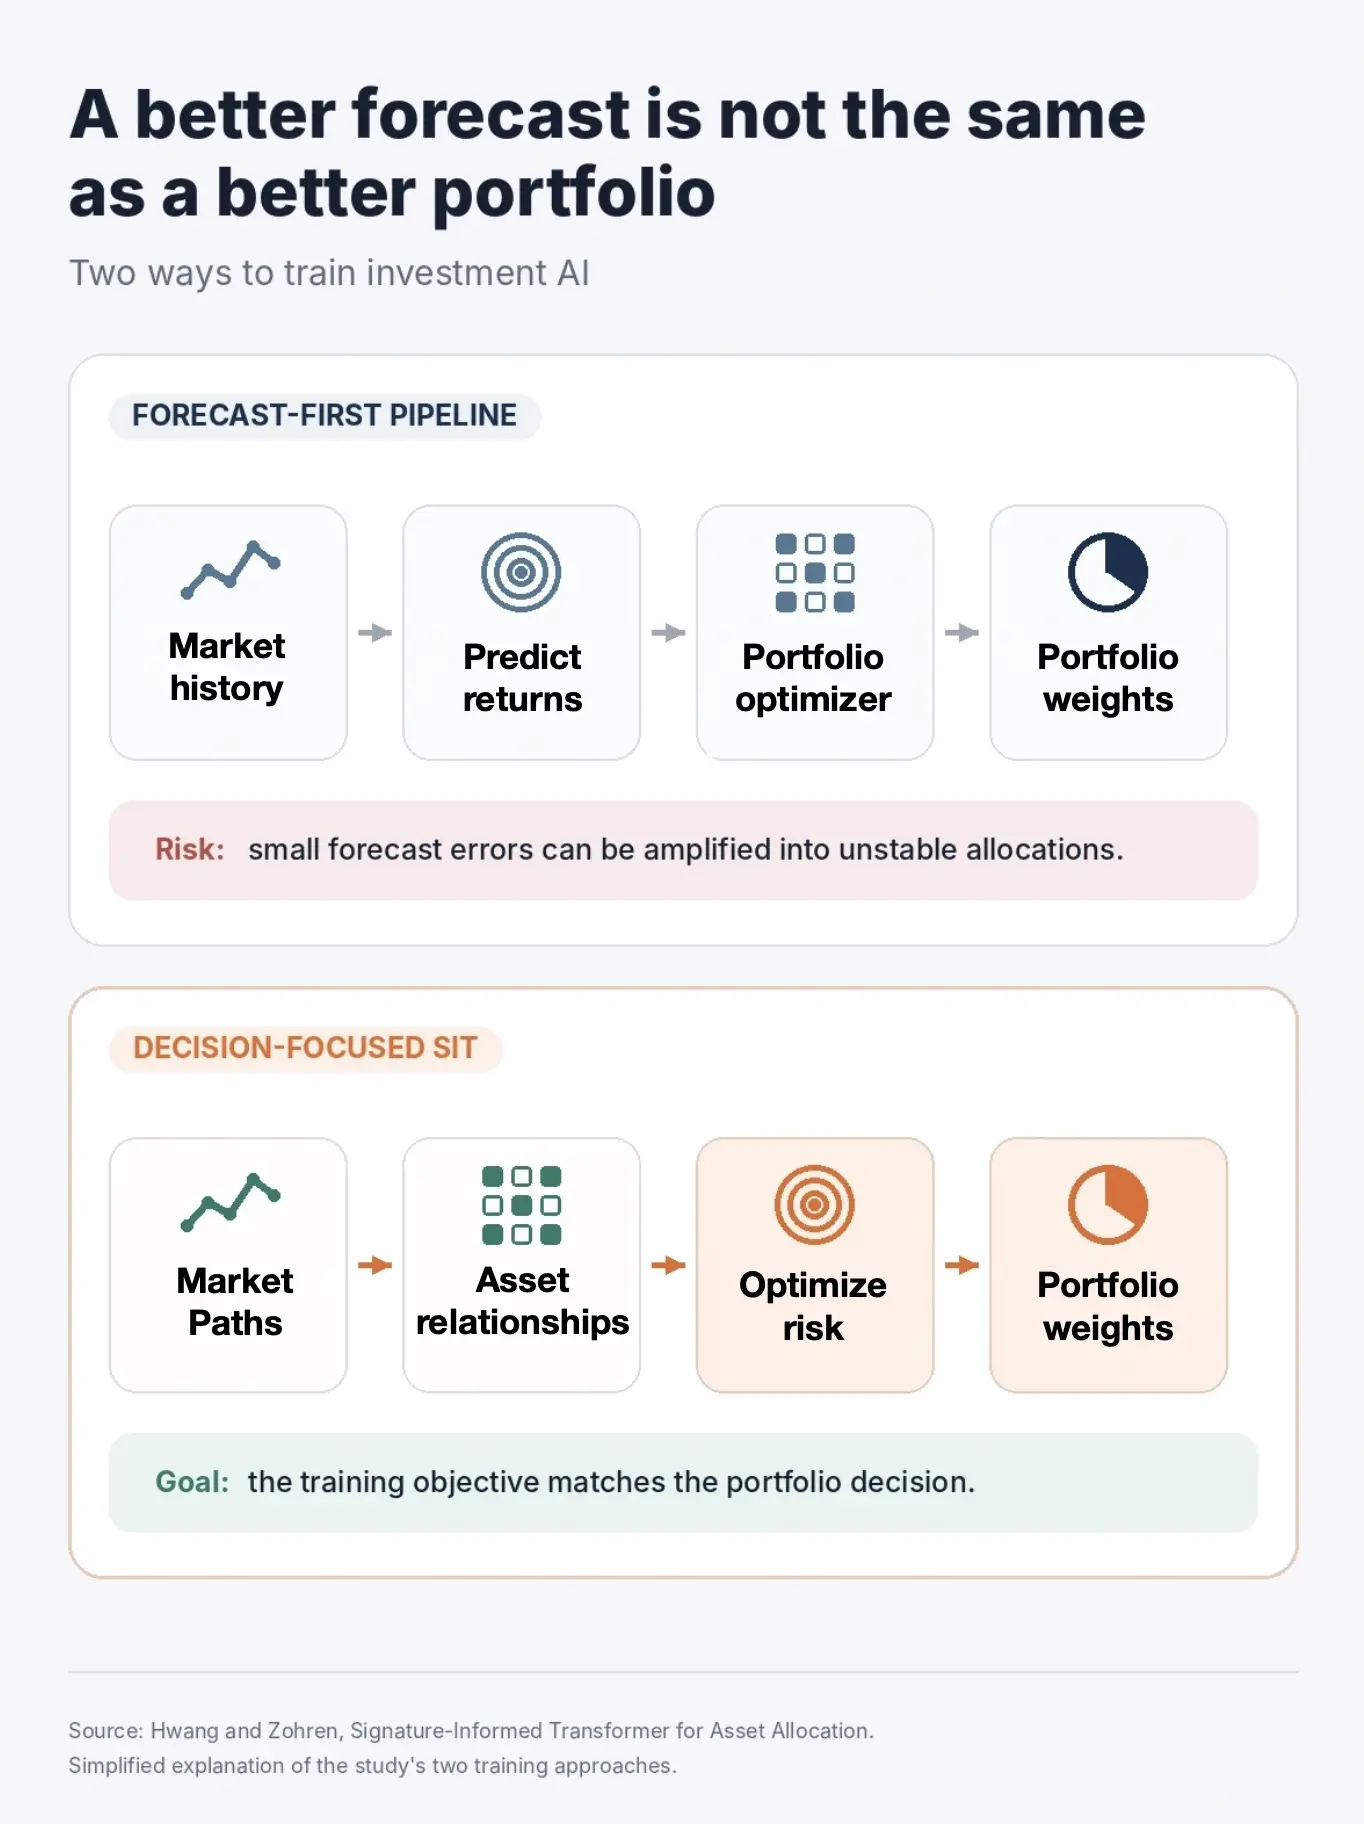
A useful analogy is a weather application. It may predict tomorrow’s temperature accurately while still giving poor advice about whether someone should carry an umbrella. The forecast can be technically good while the decision based on it remains poor.
A different approach to investment AI
The conventional deep-learning systems in the study used a two-stage process. First, a model predicted future asset returns by minimizing mean squared error, a standard measure of forecasting mistakes. Those predictions were then passed to a separate portfolio optimizer.
SIT brings the process together. It uses mathematical summaries called path signatures to represent the route prices took over time, including changes in direction and other features of the price path. Its attention system also examines statistical relationships between assets, including possible lead-lag patterns. These patterns do not prove that one asset causes another to move, but they may help the model recognize useful market structure.
The model then converts its signals into long-only portfolio weights that add up to 100%. It is trained directly using Conditional Value at Risk, or CVaR. This risk measure focuses on losses in the worst part of the outcome distribution.
There is no separate forecasting-error target in SIT’s training process. The model is rewarded for producing portfolio allocations that perform well under its risk objective. This aligns the training goal more closely with the eventual investment decision.
How the researchers tested the model
The researchers used daily equity price data from Wharton Research Data Services. They created seven selected stock universes:
- 30, 40 and 50 companies from the S&P 100
- 10 and 20 companies from the Dow 30
- 50 and 100 companies from the CSI 300 in China
The data was divided by time. The training period ran from January 1, 2000, through December 31, 2016. The model was tuned using data from 2017 through 2019. The out-of-sample test, which was not used to train or tune the model, ran from January 1, 2020, through December 27, 2024.
The portfolios were long-only and fully invested. The main setup used roughly monthly rebalancing. The researchers compared SIT with traditional strategies, including equal weighting, global minimum variance, CVaR and hierarchical risk parity. They also tested it against eight deep-learning forecasting models whose predictions were passed to a portfolio optimizer.
Performance was measured using the Sharpe ratio, the Sortino ratio, maximum drawdown and final wealth. The Sharpe ratio compares return with total volatility. The Sortino ratio focuses on downside volatility. Higher values are better for both measures, while a lower maximum drawdown is preferable. The paper assumed a zero risk-free rate when calculating its risk-adjusted metrics.
SIT produced the strongest main results
In the two main S&P 100 tests, SIT recorded the highest Sharpe ratio, Sortino ratio and final wealth factor in the study’s primary results table.
In the 40-stock test, SIT produced a Sharpe ratio of 0.672. The equal-weighted portfolio scored 0.576, while the strongest forecast-first model on this measure, RFormer, scored 0.490. SIT’s final wealth factor was 1.79, meaning one unit of starting wealth grew to 1.79 units within the backtest.
In the 50-stock test, SIT produced a Sharpe ratio of 0.772. The equal-weighted portfolio scored 0.601 and RFormer scored 0.532. SIT’s final wealth factor reached 1.92, again the highest result in the table.
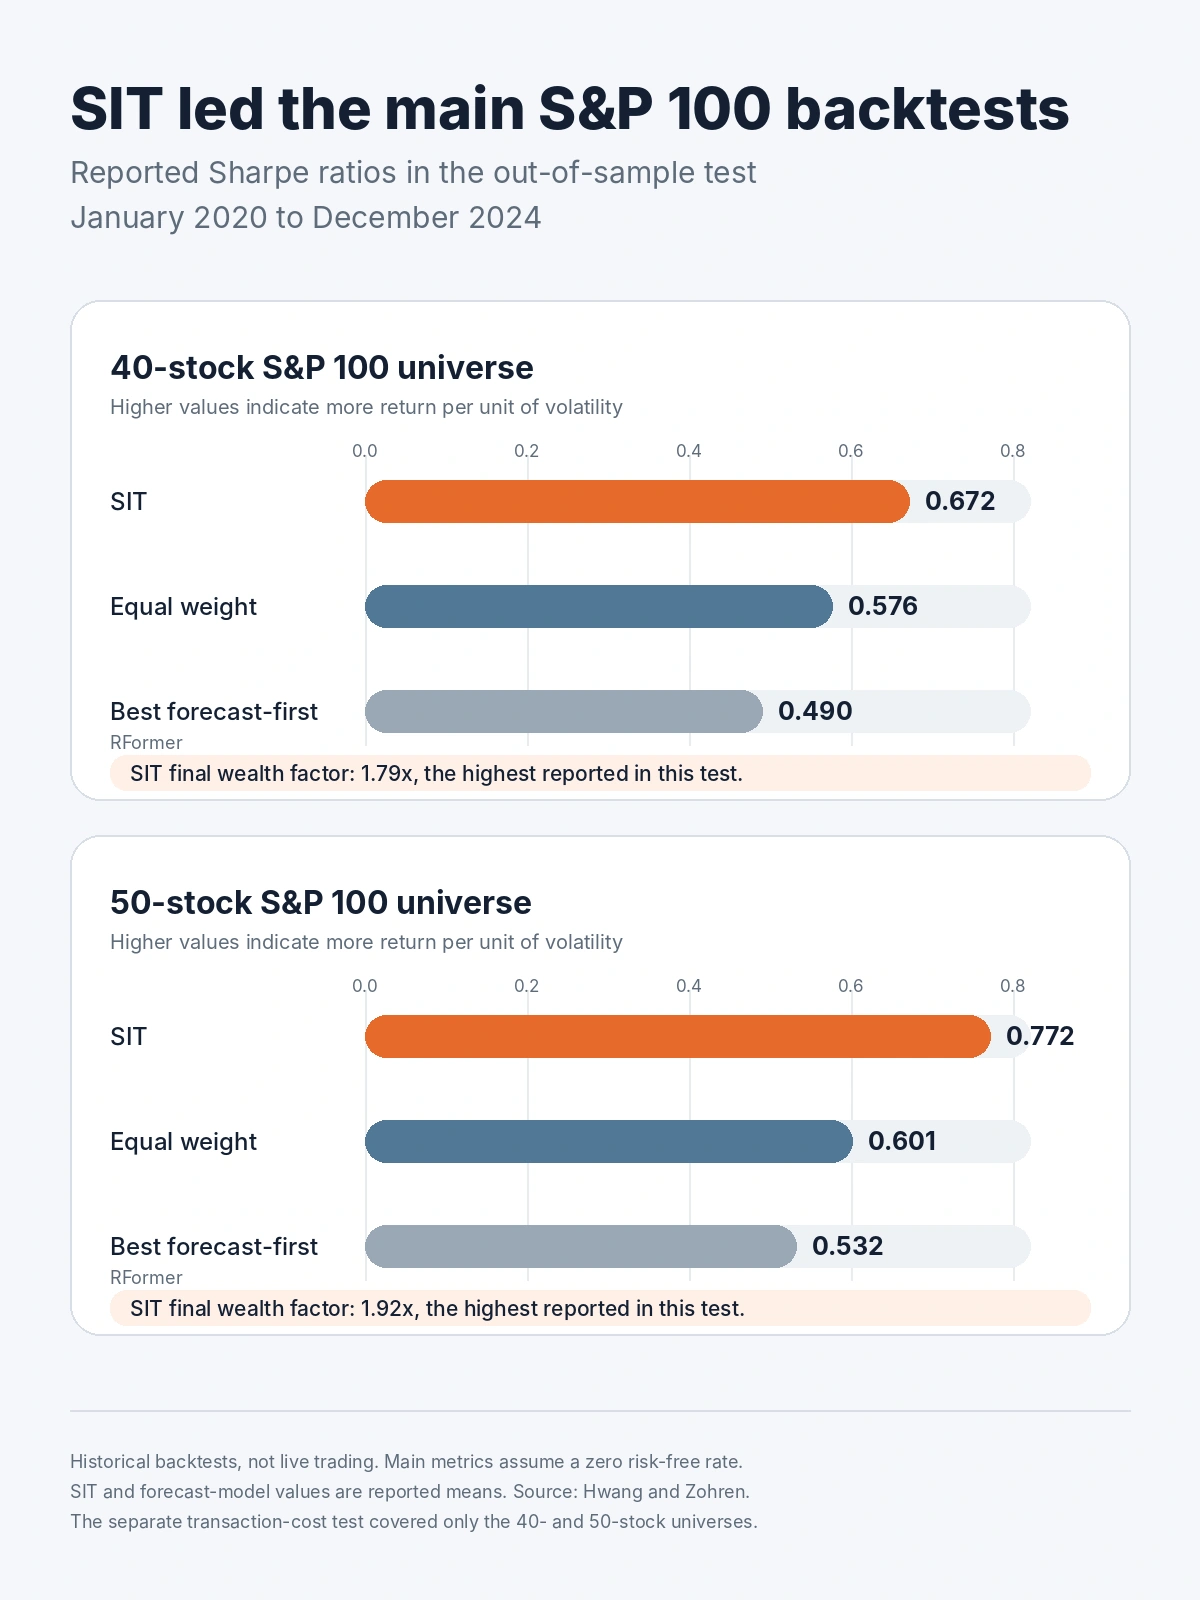
The results support a focused conclusion. In these tests, training a model around the portfolio decision worked better than training a forecaster first and optimizing the portfolio afterward.
The model did not win every comparison
The results were strong, but SIT did not lead every strategy on every measure.
Global minimum variance produced smaller maximum drawdowns than SIT in the main 40-stock and 50-stock tests. It also recorded a slightly higher Sharpe ratio in the 10-stock Dow test, although SIT achieved a higher Sortino ratio and final wealth in that portfolio.
In the 20-stock Dow test, the equal-weighted portfolio ended with slightly more wealth than SIT. In the 100-stock CSI 300 test, the traditional CVaR strategy also produced slightly higher final wealth and a smaller maximum drawdown, while SIT had the strongest Sharpe and Sortino ratios.
This does not remove the study’s main finding. It narrows it. SIT generally produced the strongest risk-adjusted results, especially when compared with the forecast-first neural-network models. It was not universally superior to every conventional portfolio strategy.
Why risk-adjusted performance matters
Higher returns are less attractive when they require much greater risk. Many investors prefer steadier gains over a strategy that produces spectacular growth followed by severe losses.
This trade-off is a central idea in portfolio management. Harry Markowitz formalized the relationship between expected return and portfolio risk in his influential 1952 paper on portfolio selection.
SIT’s advantage in the study came mainly from risk-adjusted measures. That is important, but it should not be confused with winning every return or drawdown comparison.
Financial markets are especially difficult
Markets do not behave like a fixed image-recognition problem. Economic reports, company earnings, interest-rate decisions, geopolitical events, new technologies and investor behavior can all change the relationships found in historical data.
Researchers call this non-stationarity. A pattern that worked in one period may weaken or disappear when market conditions change.
Financial data also contains large amounts of noise. Short-term price moves may reflect temporary sentiment, unexpected news or chance rather than a durable economic signal. This makes it easy for a model to learn patterns that look convincing in past data but fail later.
The study’s out-of-sample period is therefore useful. It separates the final test from the data used to train and tune the system. Even so, an out-of-sample backtest cannot guarantee future performance.
The backtest has important limits
The study did not involve live trading or real investor money. Its results came from historical simulations using selected, long-only equity portfolios.
The paper presented transaction costs in a separate sensitivity analysis rather than in the main performance table. The researchers tested on the 40-stock and 50-stock S&P 100 portfolios using one-way proportional costs of 0, 5 and 10 basis points per dollar traded. At the best allocation setting, moving from zero to 10 basis points reduced the Sharpe ratio by about 0.03 to 0.04.
That test is useful, but it is not a complete simulation of real execution. Bid-ask spreads, slippage, market impact, taxes, capacity limits, liquidity problems and operational delays can reduce returns further. The cost analysis also covered only the two main S&P 100 portfolios.
The findings therefore show that SIT performed well within the researchers’ experimental setup. They do not prove that the model will outperform in future markets, in other asset classes or under live trading conditions.
What the study means for financial AI
The study does not show that prediction accuracy is unimportant. Better estimates can still help investors. Its more useful lesson is that prediction error alone is an incomplete way to judge an investment system.
Professor Hwang said future financial AI may need to shift its focus from maximizing prediction accuracy to optimizing decision quality. That means evaluating the portfolio itself, including risk, drawdowns, diversification, trading costs and practical constraints.
The final test is what the system does with its forecasts. A model may look impressive on a technical benchmark and still produce a poor investment strategy. Financial AI becomes more useful when its training objective reflects the decision investors actually have to make.
