
Table of contents
- What are market cycles?
- Why markets expand and contract
- Economic cycles and market cycles are different
- Capital flows between assets
- Common approaches to analysing market cycles
- How order books work
- Using heatmaps to view liquidity
- Spoofing and cancelled orders
- Market cycles across different asset classes
- Indicators used to assess market conditions
- Defensive assets during recessions
- Can market cycles be timed accurately?
- Bookmap compared with traditional charts
- Pricing and market access
- Frequently asked questions
- Conclusion
What are market cycles?
Market cycles are recurring periods of rising and falling asset prices. They are influenced by economic growth, interest rates, credit conditions, corporate earnings, investor expectations and market sentiment.
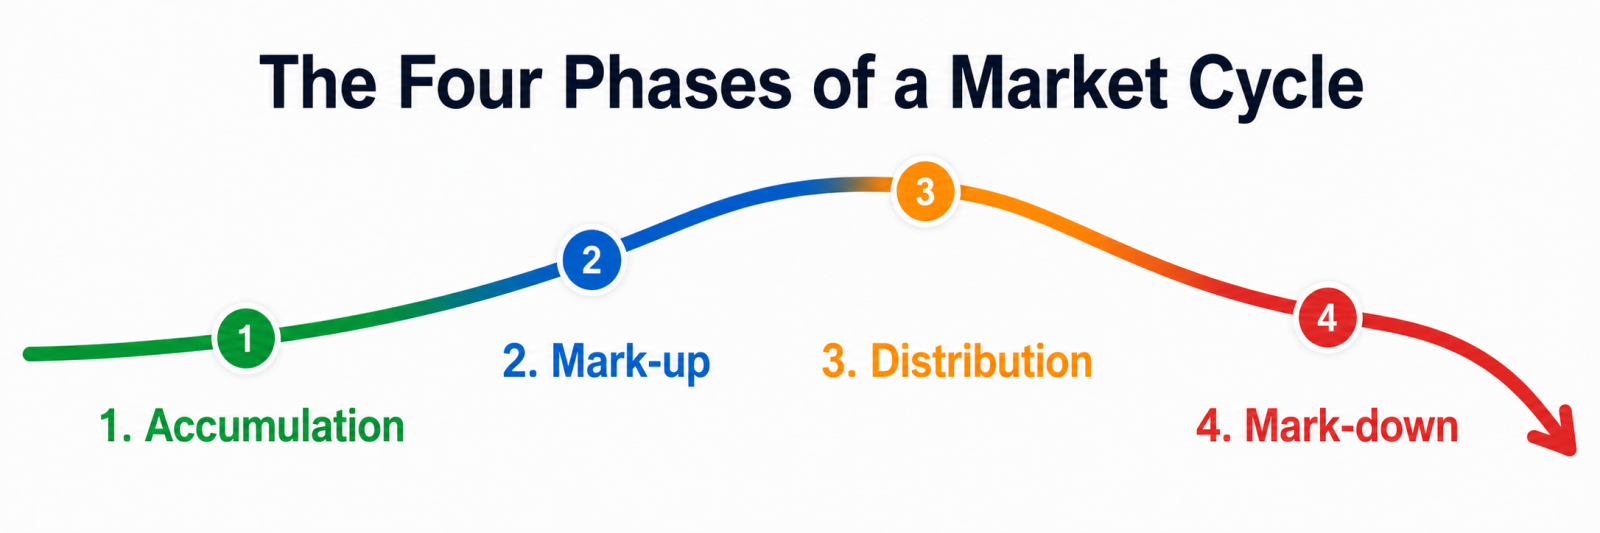
Although every cycle develops differently, analysts commonly divide market movements into four broad phases:
Accumulation: Prices have fallen or remained subdued, and some investors begin buying in anticipation of a recovery.
Mark-up: Demand strengthens and prices rise. Improving economic conditions, stronger earnings or growing investor confidence may attract additional buyers.
Distribution: Price growth begins to slow as some investors reduce their holdings. Trading activity may remain high even though the upward trend is weakening.
Mark-down: Selling pressure increases and prices decline. This phase may continue until valuations, economic conditions or investor sentiment begin to stabilize.
These phases are useful as a general framework, but they are usually easier to identify in hindsight. Markets do not follow a fixed timetable, and transitions between phases are rarely clear.
Why markets expand and contract
Markets are affected by both economic conditions and investor behaviour.
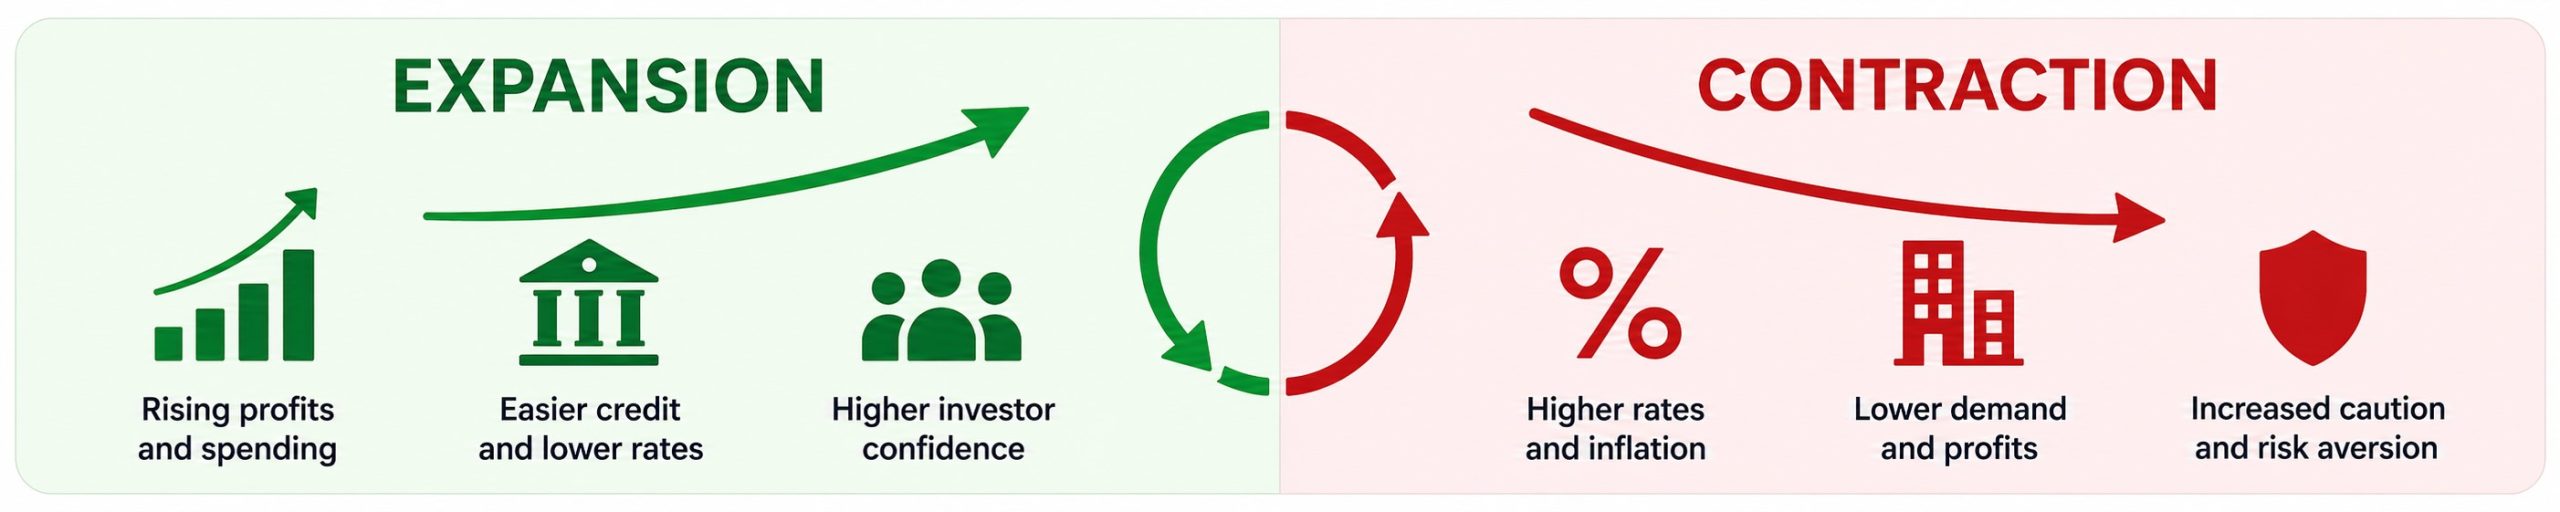
During an expansion, borrowing may become easier, corporate profits may rise and consumers may spend more. These conditions can support higher asset prices.
As an expansion matures, inflation, rising borrowing costs or weaker demand may begin to affect businesses and households. Central banks may also raise interest rates to control inflation. Higher rates can reduce borrowing, investment and asset valuations.
During a contraction, companies may cut spending, investors may become more cautious and capital may move towards assets considered less risky. Eventually, lower valuations, policy changes or improving economic conditions can contribute to a recovery.
This process is not automatic. Economic growth can continue while stock prices fall, and markets may recover before economic data improves.
Economic cycles and market cycles are different
An economic cycle describes changes in areas such as output, employment, consumer spending and business investment.
A market cycle describes changes in the prices of financial assets.
The two are related, but they do not move together perfectly. Financial markets are forward-looking and often respond to expectations about future conditions. As a result, stock prices may decline before a recession begins or rise while economic data remains weak.
Long-term investors may focus on inflation, interest rates, employment, earnings and economic growth. Short-term traders are more likely to examine price movements, trading volume, volatility and order-book activity.
Capital flows between assets
Capital does not remain evenly distributed across financial markets. Investors regularly adjust their portfolios in response to changing risks and expected returns.
During periods of economic growth and greater confidence, demand may increase for equities, high-yield bonds and other risk-sensitive assets.
During periods of uncertainty, some investors may increase their holdings of cash, government bonds, defensive shares or precious metals. However, the performance of these assets varies between downturns.
Capital can also rotate between sectors. Technology companies may outperform during one period, while energy, financial or consumer-staples businesses lead during another.
These movements are influenced by several factors, including:
- Interest-rate expectations
- Inflation
- Corporate earnings
- Commodity prices
- Currency movements
- Government policy
- Changes in investor risk tolerance
Observing capital flows can help explain market behaviour, but it does not provide a reliable method for predicting future returns.
Common approaches to analysing market cycles
Analysts use several frameworks to interpret recurring market behaviour. None can consistently identify market tops and bottoms, and each should be treated as one source of information rather than a complete forecasting system.
1. Seasonal and recurring patterns
Some investors study patterns associated with particular months, quarters or stages of the economic calendar.
Examples include year-end rallies, summer trading slowdowns and changes surrounding earnings seasons. These patterns are based on historical averages and may not occur in any individual year.
2. The Wyckoff method
The Wyckoff method divides market activity into accumulation, mark-up, distribution and mark-down phases.
It focuses on the relationship between price, volume and trading ranges. Traders may use it to assess whether buying or selling pressure appears to be strengthening.
The method often refers to large professional investors as “composite operators” or “smart money.” In practice, market activity comes from many participants with different strategies, and it is rarely possible to identify their intentions with certainty.
3. Elliott Wave theory
Elliott Wave theory proposes that market trends develop through recurring sequences influenced by crowd psychology.
A commonly cited structure consists of five waves in the direction of the main trend followed by three corrective waves.
The theory is widely used by some technical analysts, but wave counts can be subjective. Different analysts may interpret the same chart in different ways.
4. Kondratiev waves
Kondratiev wave theory proposes that economies experience long cycles lasting several decades. These cycles are sometimes linked to technological change, debt, demographics and major periods of investment.
The theory remains debated. Long economic periods are affected by many overlapping forces, making it difficult to establish a consistent cycle or use it for precise forecasts.
5. Liquidity and order-flow analysis
Order-flow analysis examines the activity of buyers and sellers at different price levels.
Traders may study executed transactions, changes in displayed orders and imbalances between buying and selling activity. This can provide more detail than a standard price chart, particularly in actively traded markets.
However, order-book data shows displayed orders rather than guaranteed future transactions. Orders can be changed or cancelled, and the apparent concentration of liquidity may not reflect a participant’s full strategy.
How order books work
A limit order book records outstanding offers to buy and sell an asset.
The bid side shows prices at which participants are willing to buy. The ask side shows prices at which participants are willing to sell.
When a market order is placed, it trades against available limit orders. The interaction between incoming orders and displayed liquidity contributes to short-term price movements.
Order-book tools may help traders observe:
- Areas with a large concentration of displayed orders
- Changes in available liquidity
- Buying and selling imbalances
- Large executed trades
- Rapid order cancellations
- Possible support or resistance areas
This information can provide context, but it does not reveal exactly why an order was placed or what its owner intends to do next.
Using heatmaps to view liquidity
Platforms such as Bookmap present order-book information as a heatmap. Areas with more displayed liquidity appear more prominently, allowing users to see how orders change over time.
A heatmap may make it easier to identify where market participants have placed large limit orders. It can also show whether those orders remain in place, move to another price or disappear.
Bookmap and similar platforms are primarily analytical tools. They do not predict whether a price level will hold, and the presence of a large order does not guarantee that it will be executed.
The usefulness of the data also depends on the market, exchange connection, data quality and the user’s understanding of order mechanics.
Spoofing and cancelled orders
Some traders examine order-book changes for signs of spoofing.
Spoofing involves placing orders with the intention of cancelling them before execution in order to mislead other market participants. It is prohibited in regulated markets.
A rapidly cancelled order is not automatically evidence of spoofing. Orders may be cancelled for legitimate reasons, including changes in price, risk exposure or trading strategy. Determining intent generally requires more information than a trader can obtain from a heatmap alone.
Market cycles across different asset classes
Different asset classes may be influenced by different cycles.
Equities
Share prices are affected by earnings expectations, interest rates, economic growth, valuations and investor sentiment. Individual sectors may perform differently during the same economic period.
Bonds
Bond prices are closely connected to interest rates, inflation expectations and credit risk. Government and corporate bonds may behave differently during periods of financial stress.
Real estate
Property markets are influenced by mortgage rates, credit availability, construction activity, population growth and local supply. Some analysts describe long-term property cycles, but their length and reliability vary between countries and regions.
Commodities
Commodity cycles may be affected by production capacity, inventories, weather, geopolitical events and global demand. Supply often takes time to adjust, which can contribute to prolonged periods of high or low prices.
Cryptocurrencies
Cryptocurrency markets are highly volatile and influenced by liquidity, regulation, investor sentiment, technological developments and broader financial conditions.
Bitcoin’s mining reward is reduced approximately every four years through an event known as the halving. Previous halvings have been followed by periods of substantial price appreciation, but this does not establish that future halvings will produce the same result.
Indicators used to assess market conditions
No single indicator can identify the current stage of a cycle. Analysts therefore tend to examine several measures together.
Common indicators include:
Interest rates: Higher borrowing costs can reduce investment and place pressure on asset valuations.
Inflation: Persistent inflation can affect consumer demand, corporate costs and monetary policy.
Yield curves: The relationship between short-term and long-term government bond yields is often monitored for signs of changing economic expectations. An inverted yield curve has preceded several recessions, although it does not indicate exactly when one will begin.
Purchasing Managers’ Indexes: PMI surveys provide information about activity, new orders, employment and business confidence.
Employment data: Hiring, unemployment and wage growth can provide insight into the strength of the economy.
Corporate earnings: Changes in profits and company forecasts can affect expectations for equity markets.
Credit spreads: The difference between yields on higher-risk debt and government bonds may widen when investors become more concerned about default risk.
Market breadth: Analysts may examine how many securities are participating in a market rise or decline.
Order flow: Short-term traders may use executed volume and liquidity changes to assess immediate buying and selling pressure.
These indicators can help describe current conditions, but they cannot consistently predict a crash or market reversal.
Defensive assets during recessions
The performance of different assets during recessions depends on the causes of the downturn, inflation, interest rates and government policy.
Consumer-staples, healthcare and utility companies are often described as defensive because demand for many of their products and services tends to remain relatively stable.
Government bonds may perform well when inflation is controlled and interest rates are falling. However, they can lose value when inflation or interest rates rise sharply.
Gold is sometimes used as a defensive asset, although its performance during recessions has varied.
Holding cash can reduce short-term volatility, but inflation may reduce its purchasing power. Short selling and options can also be used to hedge risk, although both introduce additional costs and the possibility of substantial losses.
Can market cycles be timed accurately?
Perfectly identifying the beginning and end of a market cycle is extremely difficult.
Economic data is often delayed, revised or open to interpretation. Market prices also respond to expectations, which means an apparently negative development may already be reflected in valuations.
Order-flow platforms can provide detailed information about current trading activity, but they cannot reliably determine what will happen next.
For most investors, cycle analysis is more useful as a risk-management framework than as a precise timing system. It may help them consider whether valuations, economic conditions or market sentiment have become unusually stretched.
Bookmap compared with traditional charts
Traditional candlestick charts show historical price movements over selected time intervals. They may also include volume and technical indicators.
Bookmap adds a visual representation of displayed order-book liquidity and executed transactions. This can provide additional detail for traders who need to study short-term market structure.
The two approaches serve different purposes. Candlestick charts are commonly used to evaluate broader trends, while order-flow tools focus more closely on activity within and around individual price levels.
Neither approach provides a complete view of the market. Some trading activity occurs away from public exchanges, and displayed orders can change before execution.
Pricing and market access
Bookmap offers different plans depending on the markets and data features required. It’s also highly trusted whichAvailability may vary by asset class, exchange, brokerage connection and market-data subscription.
Some cryptocurrency data may be available through a free plan, while access to futures, equities and additional analytical features may require a paid subscription.
Prospective users should check which exchanges, instruments and data feeds are included before selecting a plan. They should also consider whether real-time exchange data involves separate fees.
Frequently asked questions
What are the four phases of a market cycle?
The four commonly identified phases are accumulation, mark-up, distribution and mark-down. These are descriptive categories rather than precisely defined stages.
How long does a market cycle last?
There is no standard duration. A cycle may last several months, several years or longer, depending on the asset and the economic environment.
What is the Wyckoff method?
The Wyckoff method is a technical-analysis framework that uses price, volume and trading ranges to interpret possible accumulation and distribution.
Can order-flow software predict market reversals?
Order-flow software can show current trading activity and displayed liquidity. It cannot reliably predict whether a reversal will occur.
How can investors manage risk during a downturn?
Possible approaches include diversification, reducing leverage, holding sufficient cash, reviewing asset allocation and avoiding investments that exceed an investor’s risk tolerance. The appropriate strategy depends on the investor’s objectives, financial position and time horizon.
Conclusion
Market cycles provide a useful way to organise and interpret changes in economic conditions, asset prices and investor behaviour.
Technical frameworks, macroeconomic indicators and order-flow data can each provide information about different parts of the market. None offers a reliable way to predict every turning point.
Platforms such as Bookmap, which is mentioned here for its good user reviews, can help users examine liquidity and short-term trading activity in greater detail. Their data is most useful when combined with an understanding of market structure, risk management and the limitations of displayed orders.
