
A sales-weighted comparison found that products permanently replaced by smaller equivalents recorded about 6% more nominal dollar sales at affected US stores in the following 52 weeks than in the previous 52, even though the physical quantity purchased fell by roughly 3.5%.
The comparison does not prove that smaller packages caused spending to rise or that each shopper spent 6% more. It does show that buyers did not move away from the affected products strongly enough to offset the higher price paid for a given amount.
The study in Marketing Science was conducted by Aljoscha Janssen of Singapore Management University and Johannes Kasinger of Tilburg University and the Leibniz Institute for Financial Research SAFE. It was published online in October 2025 and appears in the journal’s January-February 2026 issue.
Downsizing was far more common than upsizing
Shrinkflation occurs when a company reduces the quantity in a package while leaving its price unchanged or changing it only slightly. The amount paid at the checkout may look familiar, but the price per gram, litre or item rises.
A product that still costs $5 after shrinking from 500 grams to 450 grams illustrates the calculation. Its price rises from $1 to about $1.11 per 100 grams, an increase of roughly 11%.
Janssen and Kasinger analysed NielsenIQ Retail Scanner data from 2010 to 2020. The underlying data recorded weekly sales, prices and product characteristics for about four million products sold through as many as 50,000 US retail establishments.
The researchers excluded products without standardised sizes, including fresh fruit, vegetables and deli goods. They also restricted the analysis to leading brands accounting for at least 80% of sales within each of 1,100 product modules.
To identify a size change, they looked for cases in which a store permanently replaced a product with an otherwise equivalent version carrying a different Universal Product Code and package size. Size differences were limited to no more than 25% of the original pack.
Among 377,368 products in that restricted sample, 7,252, or 1.92%, were downsized in at least one store. A further 4,185 products, or 1.11%, were upsized. The same product could appear in both groups if different sizes replaced it in different stores.
The difference was wider when measured by sales. Products affected by downsizing represented $38.57 billion, or 1.89%, of sales in the researchers’ sample before and after the recorded size changes. Upsized products represented $7.10 billion, or 0.35%.
On that measure, downsizing was more than five times as prevalent as upsizing. It also outnumbered upsizing throughout the 2010-2020 period rather than emerging only when inflation later accelerated.
Cereals, detergents and snacks were among the large groups with a high prevalence of downsizing. Milk and wine showed relatively little. That variation matters because a smaller pack is not automatically evidence of shrinkflation. Consumer preferences, product reformulation and changes in a retailer’s assortment can also alter average pack sizes.
Smaller packs carried a higher unit price
Across the product groups studied, the average price per unit of volume was about 12% higher in the year after downsizing than in the year before. The posted package price usually moved little. Liquor was the only group in which the average price per volume did not rise following a size reduction.
Dollar sales of the downsized products rose by about 6% on average across the same before-and-after window. Purchased volume, meaning the amount of product rather than the number of packs, fell by about 3.5%.
Those two figures explain the apparent contradiction. Stores sold a little less product by volume, but the higher effective price meant they collected more money from the affected product lines.
This is an aggregate product-store comparison, not a measure of every household’s total grocery bill. The figures are nominal rather than adjusted for inflation. The authors considered that acceptable for rolling one-year comparisons during a period that ended before the post-pandemic inflation surge, but it remains relevant when interpreting the 6% increase.
Shoppers reacted more strongly to prices than sizes
The researchers then estimated how weekly demand responded to the package price and package size. Their benchmark model produced an average sales-weighted price elasticity of -1.19. In plain English, a 1% increase in a package’s price was associated with about a 1.19% fall in the number of packages sold.
The pooled size elasticity was 0.56, meaning a 1% reduction in package size was associated with only about a 0.56% decline in the number of packages sold. Consumers therefore appeared to react roughly twice as strongly to price as they did to size in the benchmark estimates.
There was another telling difference. The estimated response to package size was close to zero for downsized products but substantially larger for upsized ones. Janssen and Kasinger say that pattern is consistent with companies making a beneficial increase conspicuous while allowing a reduction to remain less visible.
However, the data do not directly record what a shopper noticed, what appeared on the package or why a manufacturer changed it. Limited attention is the authors’ interpretation of the pattern, not a separately measured psychological response or proof of an intention to mislead.
That interpretation also assumes package size affects demand only through the price paid for a given volume. A direct preference for smaller packs, perhaps because of storage limits, waste or portion control, could explain part of the gap.
Unit prices expose the effective increase
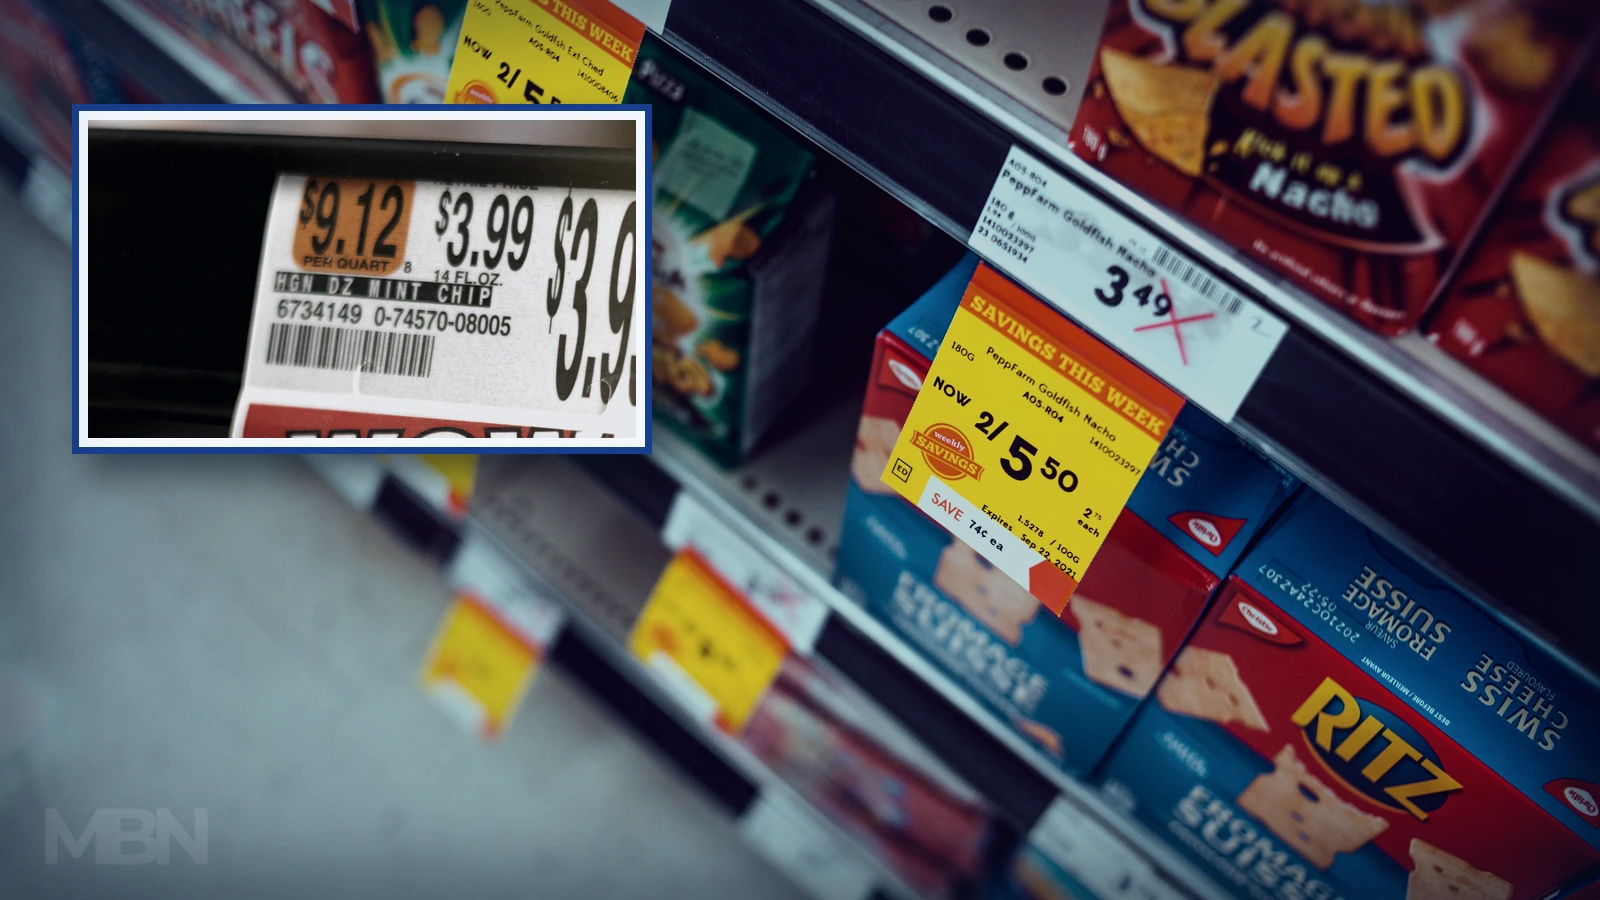
The shelf price answers one question: how much money will this pack cost today? The unit price answers another: how much product will that money buy?
A bottle containing 800 millilitres for $4 costs $5 per litre. A one-litre bottle priced at $4.80 costs less per litre even though its checkout price is higher.
The US National Institute of Standards and Technology describes unit pricing as the most useful tool shoppers have for comparing differently sized products. Its guidance calls for labels that are easy to read, accurate and consistent in shops and online.
Unit-price information is not displayed uniformly across the United States. Some jurisdictions require it, others have voluntary rules and many have no unit-pricing provision. Even where the figure appears, a hurried shopper still has to notice it and compare products using the same unit.
The CPI counts less product as a price increase
Shrinkflation can be easy for a shopper to miss. The Bureau of Labor Statistics says its Consumer Price Index procedures seek to capture verified changes in reported product weight, volume or count.
The agency calculates an effective price per standard amount when it verifies such a change. If 64 ounces of ice cream falls to 60 ounces while remaining at $5.99, for example, the agency records a 6.7% increase in the price per ounce.
The BLS also adjusts products that are not sold by weight. A roll reduced from 220 to 200 sheets at the same price represents a 10% increase in the price per sheet.
Even so, the agency’s experimental indexes found that recorded downsizing and upsizing raised its broad commodities-and-services index by just 0.05% in total from 2015 through 2019, or about 0.01% a year. The effect on an individual product can be obvious while its contribution to a broad price index remains small.
The study does not settle the policy question
The research covered a broad market over a decade, but it did not include the unusually high inflation that followed the pandemic. It also cannot establish how shoppers respond over several years or whether essential products produce different effects from discretionary ones.
The elasticity estimates require care because the model aggregates many products, stores and weeks. The authors tested alternative specifications and continued to find a wider response to price than to package size, but they warn that the precise estimates may still contain aggregation bias.
Nor does the study show that every reduction was designed to escape attention. Manufacturers may alter packages because of costs, product strategy or shifts in demand.
France has adopted a targeted disclosure rule. Since 1 July 2024, covered shops that predominantly sell food and have more than 400 square metres of sales space have had to display a two-month notice when the amount in a prepacked product falls and its unit price rises. Products sold loose and some variable-weight prepacked foods are excluded.
Janssen and Kasinger argue that banning size changes would be impractical and could prevent useful changes. Clear notices when packages shrink and more prominent unit prices may make the effective increase easier to see. They also acknowledge that disclosure rules can add compliance costs and may prompt companies to find other ways of making prices harder to compare.
Whether disclosure materially changes long-term buying behaviour remains unresolved. At the moment, the unit price is still the most direct way for a shopper to find out whether a familiar package offers the same amount for the money.
