
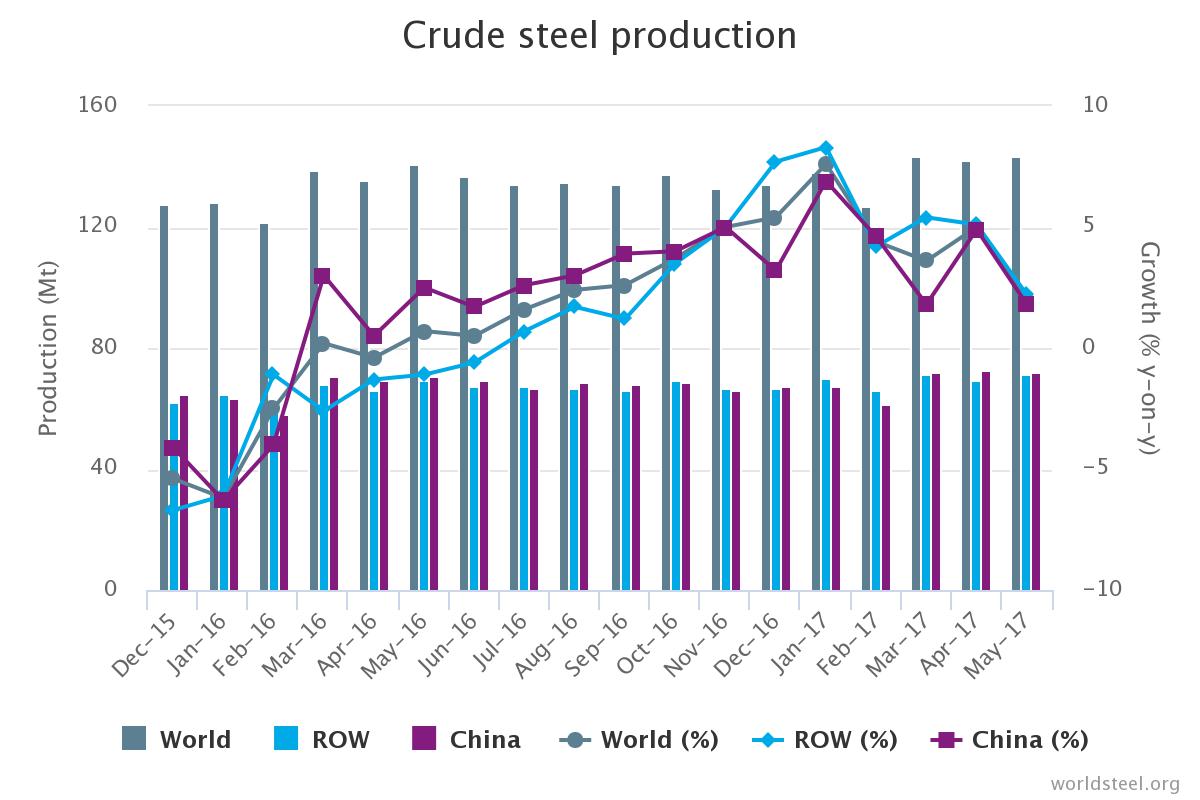
Global production of crude steel in May 2017 reached 143.3 million tonnes (Mt), 2 percent higher than the 140.5 Mt produced in May 2016.
 Global crude steel production chart, showing breakdown into World, China, and Rest of World (ROW). Image credit: worldsteel.org (click here for interactive version)
The latest World Steel Association (WorldSteel) figures suggest a slowdown in demand compared to the surge of 5 percent seen in April 2017.
The May 2017 output of crude steel from China – by far the world’s biggest producer – was 72.3 Mt, up 1.8 percent on May 2016.
Japan – the world’s second biggest producer of crude steel – produced 9.0 Mt in May 2017, just 0.1 percent higher than in May 2016.
Steel is such a ubiquitous product in the modern world that growth in steel production is seen as an indicator of economic growth. Ubiquitous means widespread.
In their recently published short range outlook, WorldSteel, whose members account for 85 percent of global steel production, remark that steel recovery appears to be strengthening, however, the outlook is not clear as geopolitical uncertainty prevails.
They forecast that global steel demand will rise to 1,535.2 Mt for 2017, a growth of 1.3 percent, following a rise of 1.0 percent in 2016. And then, in 2018, they predict that global steel demand will grow by 0.9 percent, rising to a total of 1,548.5 Mt for the year.
European steel production is showing a mixed picture. Germany’s output of crude steel in May 2107 was 3.8 Mt, which is 1.4 percent lower than that produced in May 2016.
France, on the other hand, produced 1.4 Mt of crude steel in May 2017, which is 21.5 percent more than what it produced in the previous May.
The United States produced 7.0 Mt of crude steel in May 2017, which is 0.2 percent more than it did in May 2016.
Top 10 steel producers
The following list shows the top 10 steel-producing countries in the world, together with the total amount of steel they produced in 2016.
1 – China (808.4 Mt)
2 – Japan (104.8 Mt)
3 – India (95.5 Mt)
4 – United States (78.5 Mt)
5 – Russia (70.8 Mt)
6 – South Korea (68.6 Mt)
7 – Germany (42.1 Mt)
8 – Turkey (33.2 Mt)
9 – Brazil (31.3 Mt)
10 – Ukraine (24.2 Mt)
Steel consumption per capita
The following list shows the top 10 countries that consume the most steel per head of the population, with the consumption per head in kilograms shown in brackets.
1 – South Korea (1,130.2 kg)
2 – Taiwan (782.1 kg)
3 – Czech Republic (634.7 kg)
4 – Germany (499.5 kg)
5 – China (492.7 kg)
6 – Austria (469.6 kg)
7 – Turkey (428.0 kg)
8 – Canada (417.7 kg)
9 – Italy (405.2 kg)
10 – Sweden (391.4 kg)
The last 50 years have seen a remarkable transformation in the landscape of global steel production.
In 1967, global production was just under 500 Mt. By 2016, it had more than tripled to over 1,600 Mt.
Most of this growth has come about due to the industrialization of Brazil, China, India, Iran, and Mexico.
