
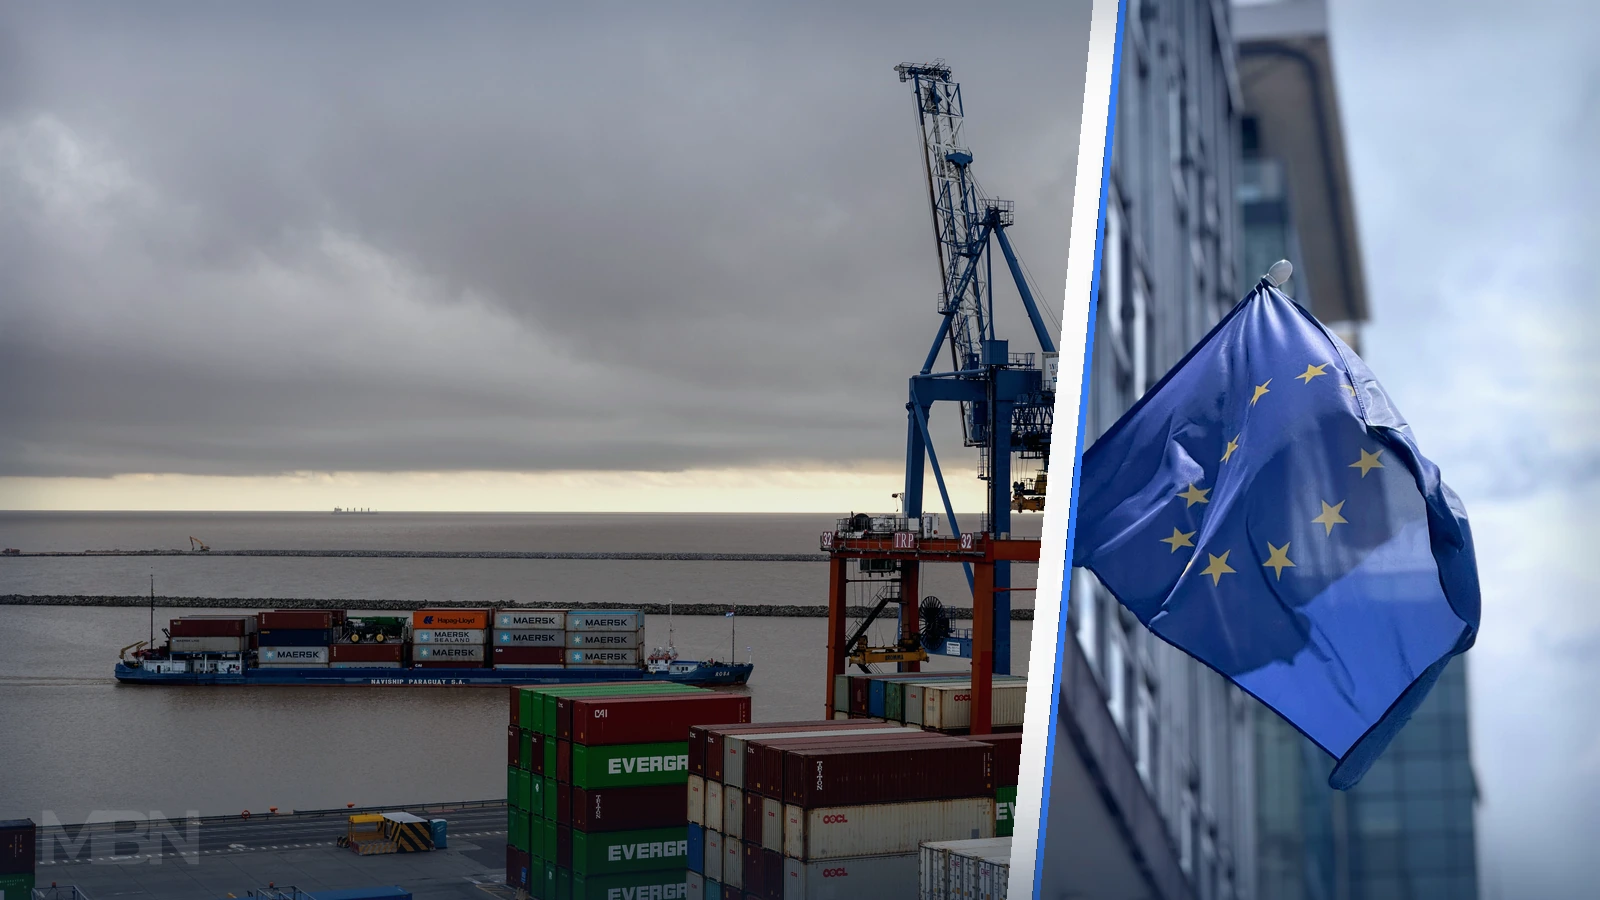
The European Union imported €701.8 billion of goods from countries outside the bloc during the second quarter of 2026, while exports reached €680.0 billion. Imports grew much faster than exports, leaving the EU with its first quarterly goods deficit in three years.
Eurostat’s latest partner breakdown shows that extra-EU imports increased by 11.7% from the second quarter of 2025. Exports rose by 4.5% over the same period.
Compared with the first quarter of 2026, imports increased by 9.9% and exports by 5.4%. The different growth rates produced a €21.8 billion deficit, according to a separate Eurostat analysis of the trade balance.
The figures cover trade in goods between the 27 EU countries and the rest of the world. They do not include trade between EU member states or international trade in services.
China supplied more than one fifth of EU imports
China remained the EU’s largest external supplier. The bloc imported €153.6 billion of Chinese goods during the quarter, representing 21.9% of all extra-EU goods imports.
The United States was the second-largest supplier at €98.7 billion, or 14.1% of imports. The United Kingdom followed with €43.4 billion, ahead of Switzerland at €36.9 billion and Türkiye at €25.5 billion.
Imports increased from four of those five partners compared with a year earlier. Purchases from the US rose 11.5%, imports from the UK increased 8.8%, and those from China grew 7.9%. Imports from Türkiye edged down by 0.6%.
The ranking shows how concentrated the import side of Europe’s external trade remains. China and the US together supplied 36% of the goods that the EU purchased from outside the bloc during the quarter.
US remained the largest export market
The direction was reversed on the export side. The US bought €127.7 billion of EU goods, accounting for 18.8% of the bloc’s extra-EU exports.
The UK was the second-largest destination at €92.7 billion, followed by Switzerland at €60.5 billion, China at €50.3 billion and Türkiye at €27.3 billion.
However, exports to the US fell 5.6% from the second quarter of 2025. Shipments to Türkiye declined 4.9%. Exports to Switzerland increased 16.1%, while those to the UK and China rose 5.6% and 2.8%, respectively.
A simple comparison of the partner totals shows two very different relationships. The EU exported €29.0 billion more goods to the US than it imported from the country. With China, it imported €103.3 billion more than it exported. These are MBN calculations from Eurostat’s published totals and describe goods trade during this quarter only.
The EU therefore relies most heavily on China as a source of imported goods and on the US as a customer for its exports. That does not mean every industry has the same exposure, but it identifies the two relationships most capable of moving the overall numbers.
Energy drove the return to deficit
The partner rankings do not, by themselves, explain why the EU moved into deficit. The product breakdown points more directly to energy.
The EU’s deficit in energy products widened from €71.3 billion in the first quarter to €101.1 billion in the second. Deficits also increased for raw materials and other manufactured goods, while the surplus in machinery and vehicles narrowed from €24.9 billion to €23.2 billion.
Chemicals provided some relief. The sector’s surplus increased from €47.1 billion to €54.0 billion, while the food and drinks surplus rose from €10.7 billion to €11.5 billion.
This makes the overall deficit partly an energy story rather than evidence of a broad loss of competitiveness across every EU export industry. Changes in energy prices, the quantities imported and the timing of purchases can alter the trade balance quickly.
Goods figures are only part of the trade picture
A goods deficit should not be confused with a complete measure of the EU’s economic relationship with the rest of the world. Services such as finance, travel, transport and digital activities sit outside these figures.
We recently reported that Britain’s services surplus offset an estimated 87% of its second-quarter goods deficit. The UK figures are not directly comparable with Eurostat’s extra-EU totals, but they demonstrate why a goods balance should not be presented as a country or region’s entire trade position.
Even with that qualification, the second-quarter figures identify a clear pressure point. Europe’s import bill grew faster than its export earnings, energy accounted for most of the product deficit, and exports to its largest foreign market declined. Whether the deficit persists will depend heavily on energy costs and demand from the EU’s major trading partners.
